

Will HBAR Price Reach $5?
Can a single breakthrough in tokenized finance push HBAR price into a long-term rally? That’s the question many traders are asking after Archax, a regulated digital asset exchange, executed the world’s first after-hours ETF transaction directly on the Hedera Network. This moment doesn’t just validate Hedera’s technology—it challenges the boundaries of traditional finance. As tokenized ETFs start moving on-chain, investors are beginning to wonder if HBAR is finally entering its breakout phase—or if it’s another false dawn in a volatile market.
The Institutional Breakthrough Behind Hedera’s Momentum
Hedera just made a statement move in real-world finance. Archax, a UK- and EU-regulated digital asset platform, successfully tokenized and executed the first after-hours transaction of the Canary HBR ETF directly on the Hedera network. This isn’t just another blockchain partnership. It’s a live demonstration that regulated ETFs can exist, trade, and settle on a distributed ledger outside traditional market hours — a first for the financial industry.
For Hedera price, this milestone validates the network’s mission to bridge traditional and digital markets. It shows that blockchain infrastructure can deliver continuous 24/7 financial operations without sacrificing regulatory oversight. Institutional players — from asset managers to exchanges — now have a real example of how compliant, on-chain financial instruments can operate on Hedera. That credibility boost could spark a new wave of enterprise adoption, expanding use cases for HBAR beyond retail speculation.
Hedera Price Prediction: Accumulation or Another Pullback?
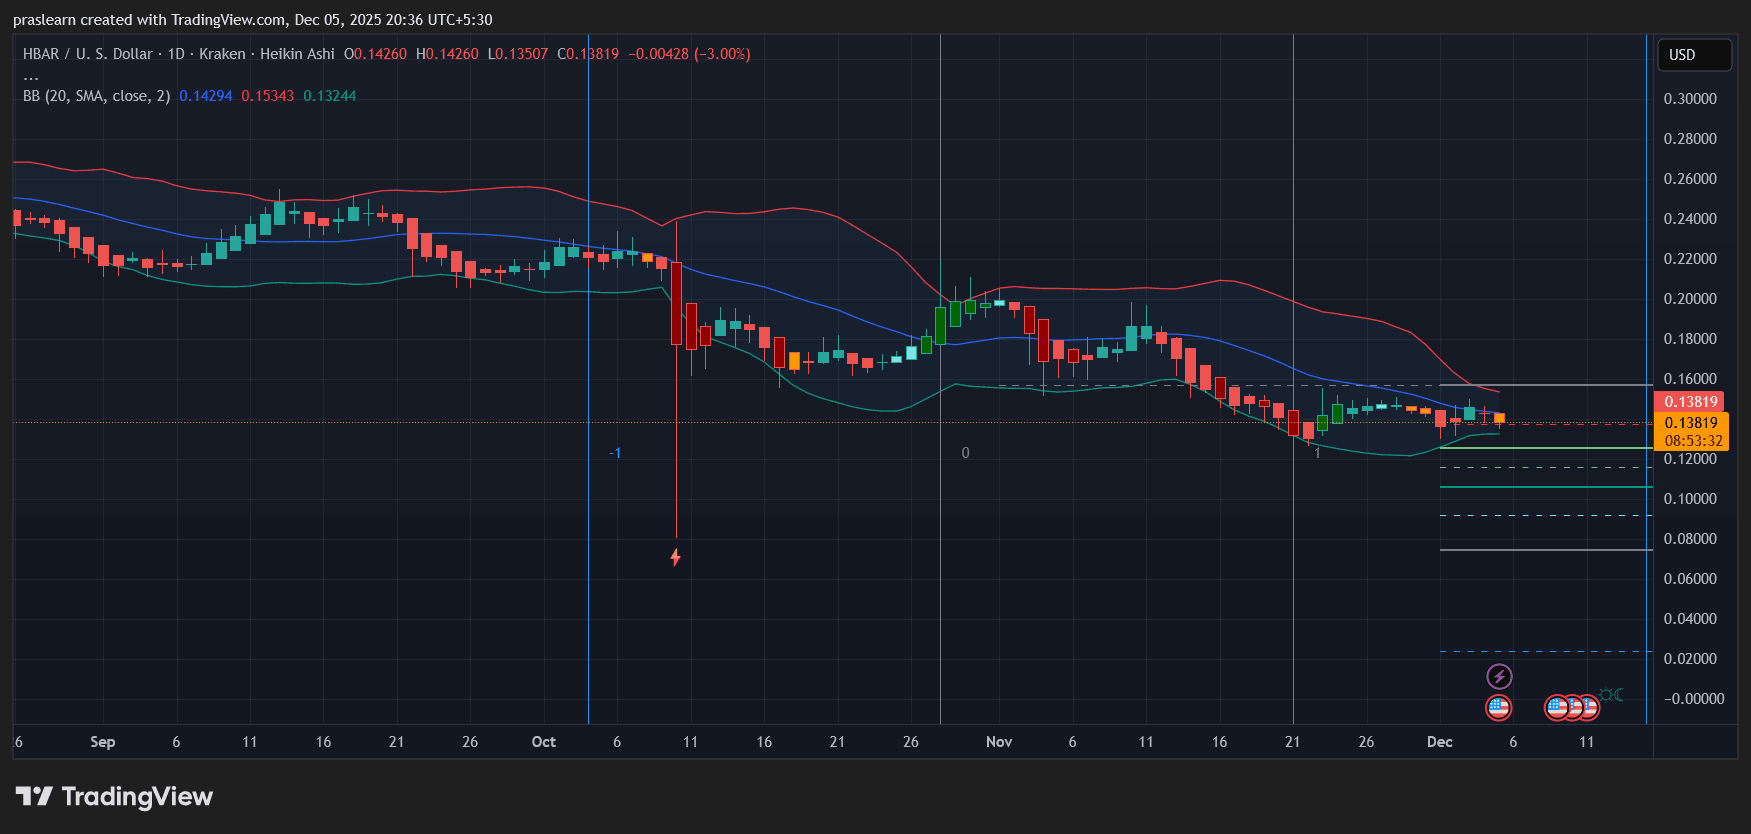 HBAR/USD Daily Chart- TradingView
On the daily chart, HBAR price trades near $0.138, locked inside a tightening Bollinger Band range. The upper band sits around $0.153, while the lower hovers near $0.132, signaling a squeeze that usually precedes a decisive move. Over the past few months, the coin has stayed below its mid-band resistance, reflecting sustained bearish pressure but also showing early signs of bottom formation.
Volume remains subdued, which often indicates accumulation rather than panic selling. The Heikin Ashi candles are beginning to flatten, a sign that sellers are losing control. If HBAR closes consistently above $0.16, it could trigger a shift toward the next resistance levels at $0.20 and $0.25. Conversely, a breakdown below $0.12 might drag it toward the psychological $0.10 zone. In short, the current setup suggests quiet consolidation — a base-building phase that often precedes a larger rally.
Hedera Price Prediction: Can HBAR Price Realistically Reach $5?
Reaching $5 from the current range would require roughly a 36× gain, which is ambitious but not impossible in a full crypto bull cycle. The token’s path depends on sustained institutional adoption. If Archax’s ETF experiment evolves into a broader trend — with tokenized funds, equities, or bonds moving to Hedera — the network’s transaction volumes and visibility could skyrocket.
However, this scenario requires more than technical progress. It demands liquidity, listings, and steady network activity. The ETF news provides a solid narrative foundation, but technical confirmation must follow: strong breakout above $0.25, then $0.50, before even approaching multi-dollar targets.
For now, HBAR sits in a low-volatility pocket where risk-reward favors early positioning for patient investors. If the market recognizes Hedera as the go-to chain for regulated tokenization, the $5 mark becomes a long-term aspiration — not a fantasy.
Final Take
$HBAR current trajectory combines quiet technical accumulation with a powerful new use case in tokenized ETFs. While short-term upside depends on a breakout above $0.16, the long-term story hinges on institutional integration. The Archax transaction proved that Hedera’s technology isn’t just theory; it’s operational at a regulated level.
If that adoption curve steepens through 2026, HBAR could evolve from a stagnant altcoin into a serious player in blockchain-based finance — and that’s when $5 stops sounding unrealistic.


You May Also Like
Analyst Says XRP Looks Ready for a Massive Breakout. Here’s the Signal

Alphabet (GOOGL) Stock Nears $5 Trillion Market Cap Ahead of Google I/O Tuesday


