

This 11.7 Billion Dogecoin Wall Could Be Key Resistance For DOGE, Analyst Says
An analyst has pointed out where a key resistance could be located for Dogecoin, based on on-chain supply distribution data.
Dogecoin Has A Large Supply Cluster Present At $0.20
In a new post on X, analyst Ali Martinez has talked about where resistance lies for Dogecoin based on Glassnode’s Cost Basis Distribution (CBD). The CBD is an indicator that tells us about the amount of DOGE supply that was last acquired at the various price levels that the memecoin has visited in its history.
Below is the chart shared by Martinez that shows the recent CBD heatmap for Dogecoin.
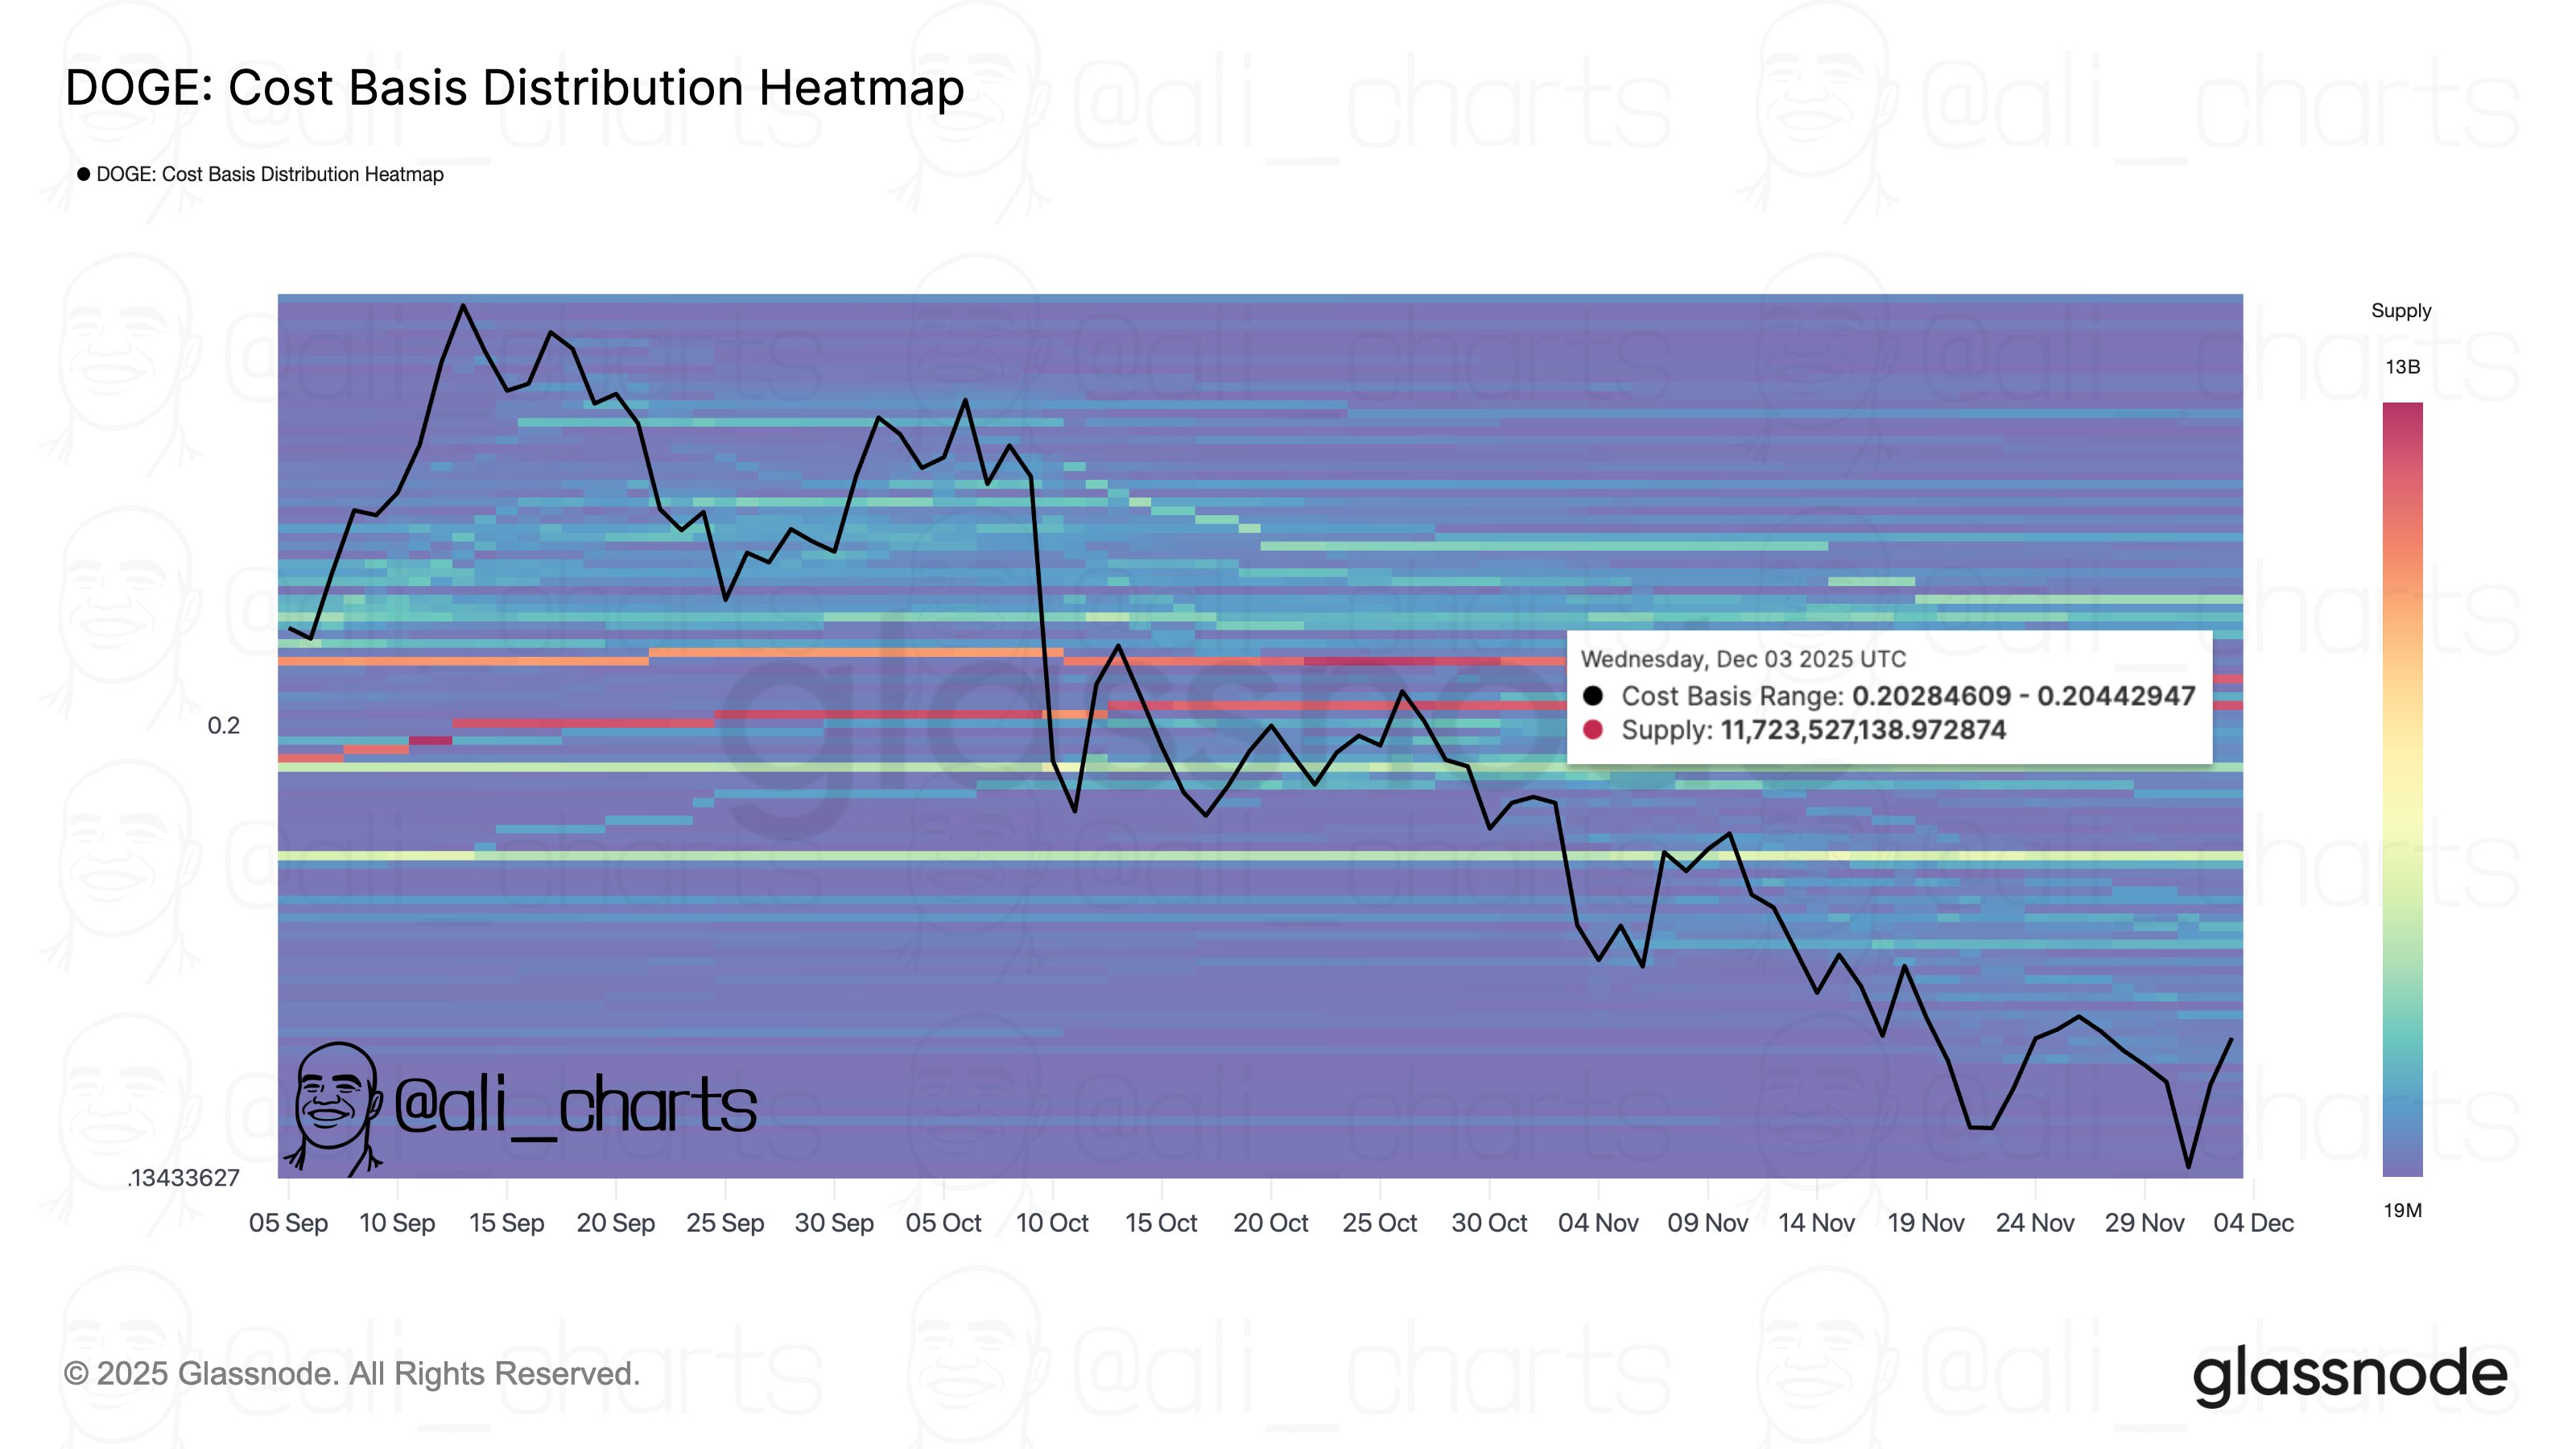
As is visible in the graph, the Dogecoin CBD has flagged the zone around $0.20 as one where investors did some heavy buying. More specifically, over 11.7 billion tokens have their cost basis at this level.
Considering that DOGE is trading notably under the mark right now, all this supply would naturally be in the red. The asset rising to this level could cause a strong reaction from the investors, as these tokens will get back to their break-even.
Generally, holders in loss can be desperate for the price to reach back to their cost basis. Once the asset does rise to their acquisition level, some of these investors choose to sell, fearing that the rebound is only temporary. This can make large cost basis levels above the asset’s price potential zones of resistance.
Between the current price and $0.20, there aren’t any other regions in the CBD that are as dense with supply. Based on this, Martinez has noted, “$0.20 is the key resistance for Dogecoin.” It now remains to be seen whether DOGE will retest this level anytime soon.
In some other news, the memecoin has seen a spike in network activity recently, as the analyst has pointed out in another X post.

In the chart, the indicator shown is the Number of Active Addresses, which measures, as its name suggests, the daily number of addresses that are participating in some kind of transaction activity on the Dogecoin network.
It would appear that this indicator has registered a surge recently, with a peak 71,589 addresses making transfers on the blockchain. This is the largest spike that the metric has observed since September.
The trend suggests that attention has returned back to the Dogecoin network after a slump, but only time will tell whether this activity pertains to accumulation or distribution.
DOGE Price
At the time of writing, Dogecoin is trading around $0.138, down over 7% in the last week.
You May Also Like

Nvidia Faces Class Action Over Alleged Hidden Crypto GPU Revenue

Ethereum koers toont zeldzaam dubbel koopsignaal en richt zich op $4.550


