Bitcoin Settles In Consolidation Zone – Levels To Watch
Bitcoin (BTC) trades just below $90,000 after a fluctuating week of price action resulted in a net loss of 1.8%. Despite initial hopes of a resurgence in late November, the premier cryptocurrency is now 29.16% away from its all-time high. Going by the price action, popular analyst with the X username PlanD postulates BTC is now in consolidation guided by two major price levels.
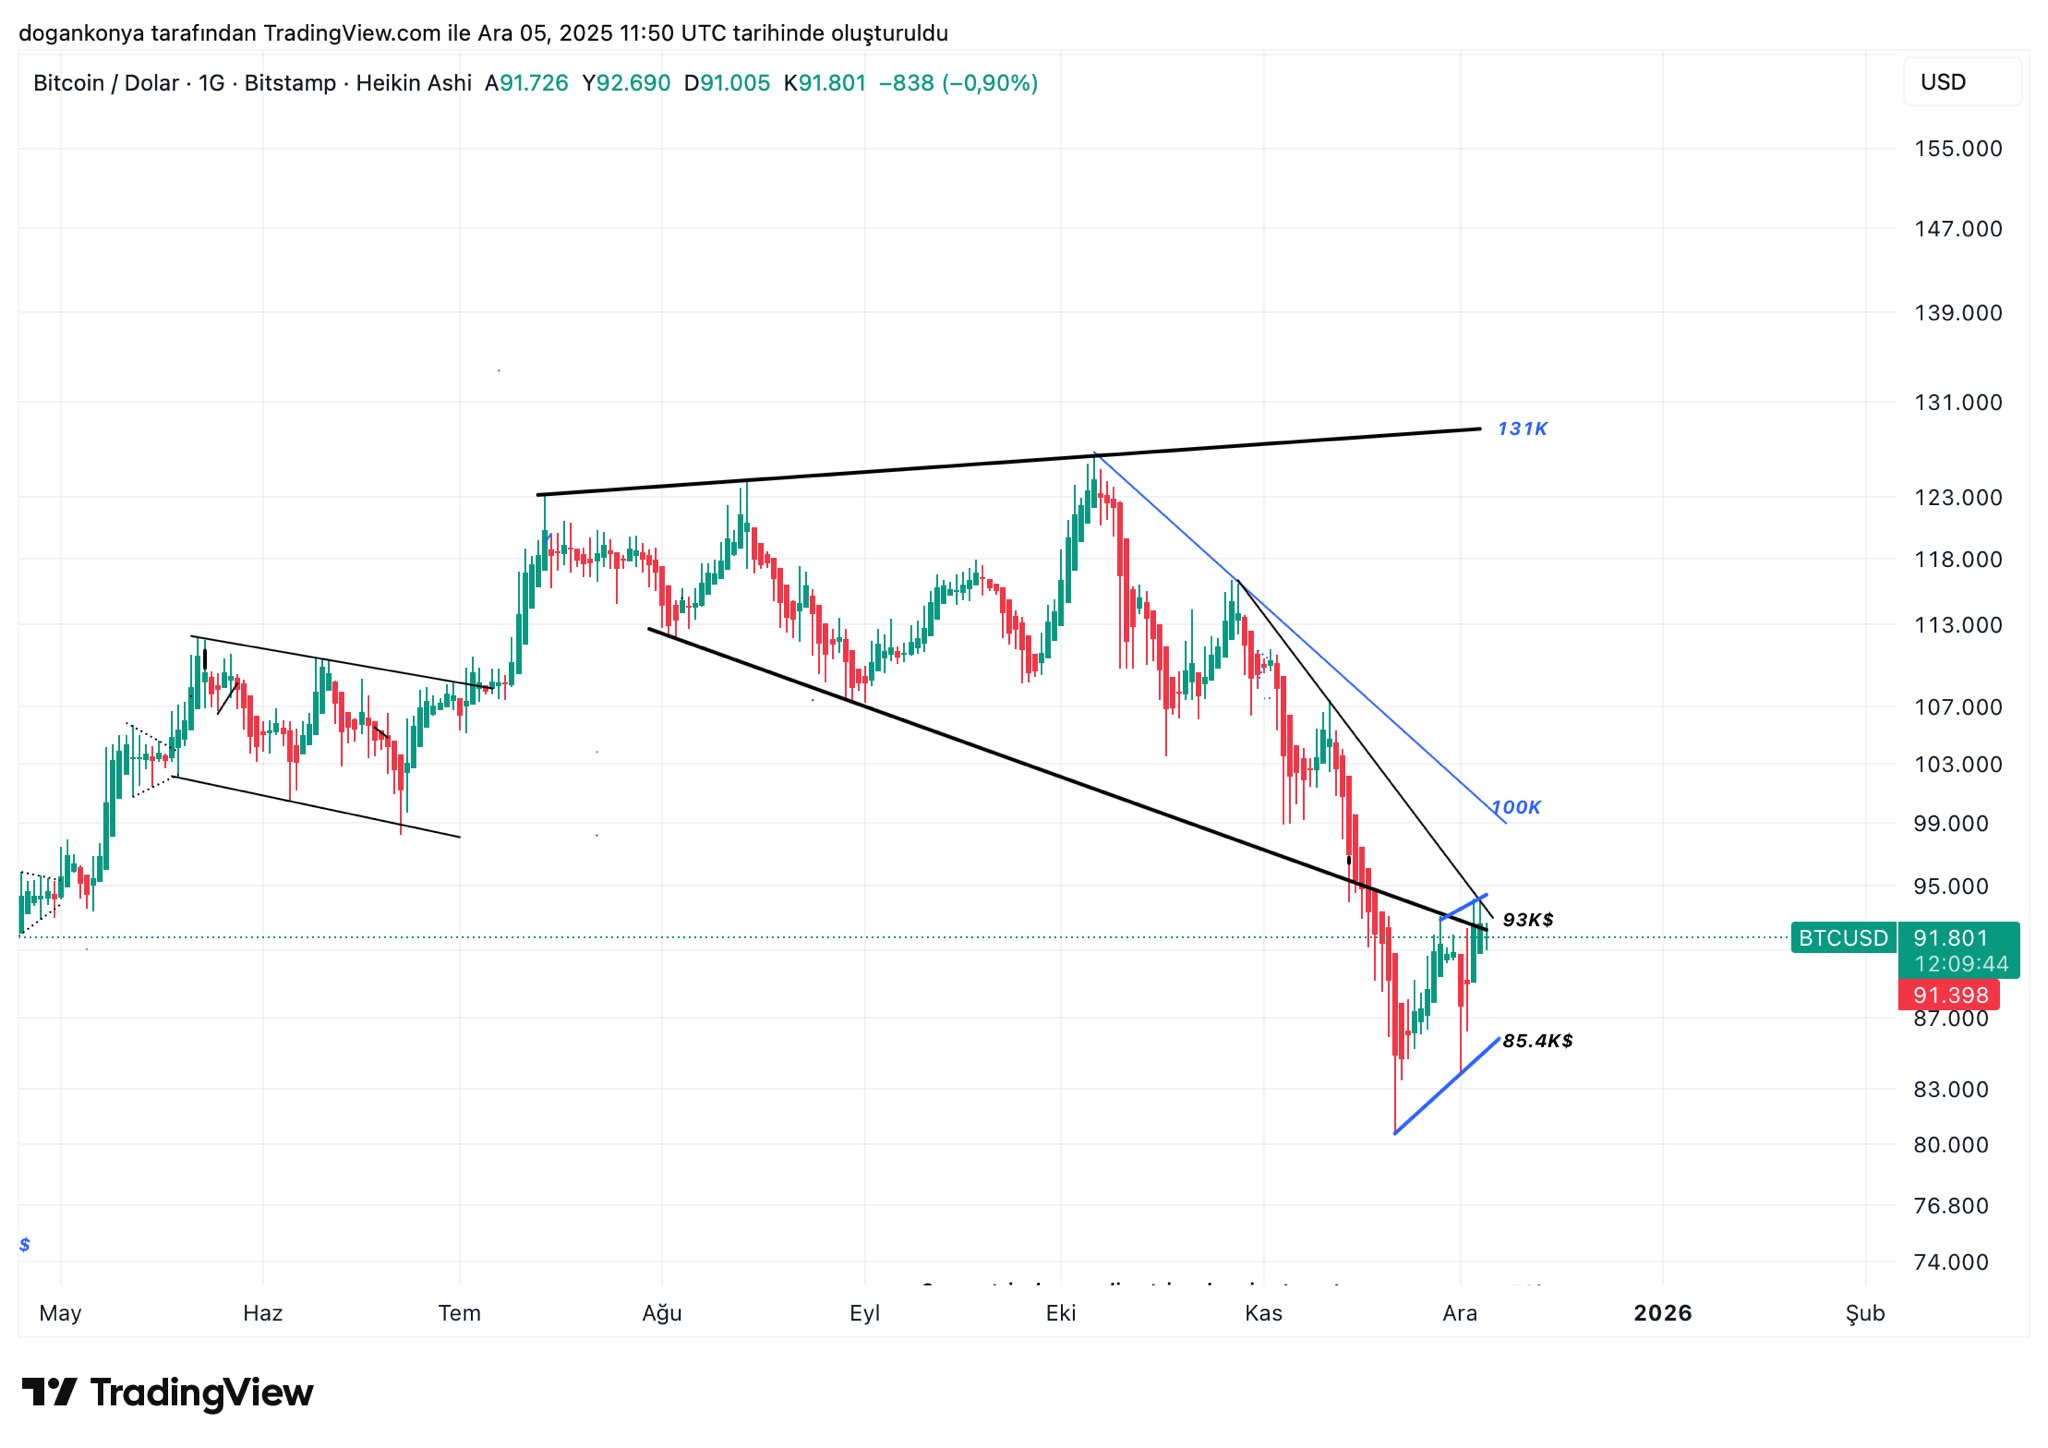
Bitcoin Moves In Key Range Between $85,000-$93,000, Market Breakout Awaits
In an X post on December 5, PlanD provides an update on a continued analysis of the Bitcoin market, stating the crypto market leader appears to be building momentum within a set price range. Notably, recent price action has pushed the flagship cryptocurrency below the lower boundary of a broadening ascending channel between $93,000 and $131,000, raising fears of a bear market. However, Bitcoin has repeatedly rebounded, forming a strong consolidation range between $85,400 and $93,000. PlanD defines the present market condition as Bitcoin being in a decision zone and needing a price breakout to determine its next major direction. The analyst states that if Bitcoin moves to overcome the price resistance at $93,000, its initial price target lies at $100,000. A successful reclaim of this psychological six-figure level would confirm renewed bullish intent and stronger potential for a full market revival.
On the other hand, if Bitcoin breaks below the vital support zone at $85,300, investors should expect steeper losses. In this case, PlanD projects a price drop to around $72,000, representing a potential 19% decline from present market prices. Notably, considering the recent market volatility, the ongoing consolidation may close out sooner than expected, to establish a clear market direction.
Bitcoin Price Overview
According to data from CoinMarketCap, Bitcoin trades at $89,703, reflecting a price loss of 2.99%. Meanwhile, the daily trading volume is up by 4.56% and valued at $63.16 billion.
Following the turbulent price action of the last week, BTC’s price struggles in Q4 continue against previous popular predictions. Still, several bullish indicators could support a rebound before year-end. Key catalysts include a widely anticipated interest rate cut at the upcoming Federal Open Market Committee (FOMC) meeting on December 9–10.
In addition, market sentiment is benefiting from speculation that pro-crypto economist Kevin Hassett could succeed Jerome Powell as Federal Reserve Chair in 2026.


You May Also Like

Bitcoin etfs snap four-month slump as March inflows reach $1.32B

Binance Perpetual Futures Revolution: QQQ and Major US Stocks Enter Crypto Derivatives Market with 10x Leverage