Terra Classic (LUNC) Price Prediction 2025–2029: Will LUNC Hit $0.0001 Soon?
- LUNC’s Momentum Remains Strong, Targeting $0.0001 After a Recent Surge
- Increased inflows suggest sustained interest, with key resistance levels in focus.
- LUNC’s trendline breaks, setting up for a potential breakout toward $0.0001.
Terra Classic (LUNC) is currently trading at $0.0000625, having surged by more than 11%. This sharp breakout followed a period of consolidation and represents a significant move after the token had spent much of the year under distribution. Despite the recent rally, the market structure appears bullish, and technical indicators suggest that LUNC could aim for further gains. If LUNC can maintain above critical support levels, it may be poised to target $0.0000800 and potentially $0.0001000. However, the coming days will be crucial to determine if this momentum can be sustained or if the price will correct.
Also Read: XRP Price Prediction for December 7: Sellers Continue to Dominate as Weak Momentum Persists
LUNC’s Surge Signals a Strong Bullish Foundation
Terra Classic has shown significant price strength, climbing from $0.0000350 in early November to over $0.0000625. This upward movement follows a period of prolonged downtrend and was catalyzed by a surprising event that saw increased social attention and media coverage. The price surge was matched by significant trading volume, with $3.53 million in net inflows on the previous day and another $1.46 million today. This uptick in inflows indicates that renewed interest in LUNC is driving the price action, suggesting that traders are confident about its future prospects.
Despite the pullback, LUNC’s position above critical moving averages such as the 20-day EMA at $0.0000351 and the 50-day EMA at $0.0000432 suggests that the bullish trend remains intact. The alignment of these EMAs, along with the ascending trendline from mid-October, points to a solid foundation for further price action. If LUNC holds above these levels and stabilizes, it may be positioned for another rally.
Technical Analysis: LUNC Positioned for More Gains, But Resistance Looms
From a technical perspective, Terra Classic’s price action remains promising. The daily chart shows LUNC holding above its key EMAs, including the 20-day and 50-day EMAs, which have acted as strong support since the breakout. After testing the resistance at $0.0000625, the price is now retracing to the 20-day EMA, and if LUNC manages to close above this level, it will likely continue the upward trend.
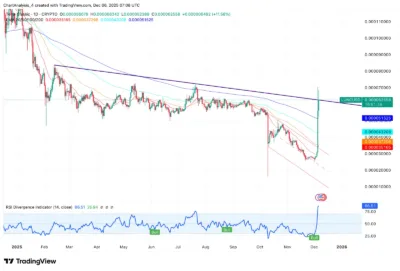
Source: Tradingview
Despite the recent correction, the overall technical structure is still bullish. All major exponential moving averages (EMAs) are sloping upwards, confirming the ongoing positive trend. The widening of the Bollinger Bands also suggests increased volatility, which typically follows a breakout. Currently, LUNC sits in the upper half of the Bollinger Bands, signaling that the price might have been overextended but could cool off before more gains emerge.
Short-Term Momentum: Stabilizing After Pullback
On the 30-minute chart, LUNC is attempting to stabilize above key support levels, with the Supertrend indicator flipping green at $0.0000542. This suggests that LUNC has found initial support and could be preparing for another rally. The RSI, which has surged to 86, signals that while the asset is currently overbought, momentum has not yet shifted to bearish.
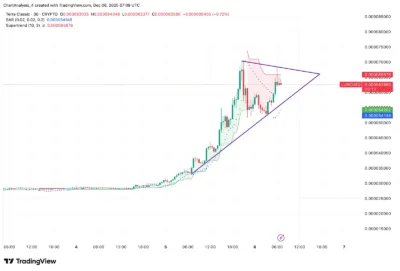
Source: Tradingview
The short-term resistance for LUNC lies between $0.0000650 and $0.0000700, with a key psychological barrier at $0.0000700. If LUNC can break above this resistance and sustain the price above $0.0000700, it could pave the way for a retest of the $0.0000800 and $0.0001000 levels. However, failure to break through these resistance zones could lead to further consolidation or a deeper pullback toward the $0.0000540 support region, where stronger buying interest is expected.
Support and Resistance Levels: LUNC Needs to Hold $0.0000542 to Maintain Bullish Trend
For the bullish case to remain intact, LUNC must hold above the short-term support level at $0.0000542. A breakdown below this level would signal that bearish pressure is increasing, which could lead to a deeper pullback toward the $0.0000432 and $0.0000380 levels. However, if LUNC can break above the $0.0000700 resistance and hold its gains, it may target the $0.0000800 and $0.0001000 levels in the near future.
The immediate support zone between $0.0000542 and $0.0000432 remains crucial for the continuation of the bullish trend. A failure to hold above these levels would suggest weakening momentum, while a successful breakout above $0.0000700 could mark the beginning of a new rally.
Bullish and Bearish Scenarios for Terra Classic (LUNC)
For the bullish scenario to materialize, LUNC must secure a daily close above $0.0000658 and then break through the $0.0000700 resistance zone. This would signal that buyers are absorbing supply and are ready to push the price back toward the $0.0000800–$0.0001000 range. A sustained move above these levels could pave the way for further price appreciation toward $0.0001100.
On the other hand, if LUNC fails to hold above the $0.0000542 level, the pullback could intensify, and the price might test lower support levels at $0.0000432 and $0.0000380. A breakdown below these levels would suggest that the recent price spike was unsustainable and that the trend might reverse.
Terra Classic (LUNC) Price Prediction 2025–2029
| Year | Minimum Price | Average Price | Maximum Price |
|---|---|---|---|
| 2025 | $0.0000500 | $0.0000625 | $0.0000800 |
| 2026 | $0.0000600 | $0.0000700 | $0.0000900 |
| 2027 | $0.0000700 | $0.0000850 | $0.0001000 |
| 2028 | $0.0000800 | $0.0000950 | $0.0001100 |
| 2029 | $0.0000850 | $0.0001000 | $0.0001200 |
2025
Terra Classic enters 2025 with strong technicals, holding above crucial moving averages and trendlines. If LUNC can break above the $0.0000700 resistance zone and hold above it, the price could target $0.0000800–$0.0001000 by the end of the year.
2026
Assuming Terra Classic maintains its momentum, we could see the token pushing toward the $0.0000700–$0.0000900 range by 2026, especially if the broader cryptocurrency market experiences a positive cycle.
2027–2028
By 2027 and 2028, as Terra Classic continues to gain adoption and sees increased interest, the price could steadily climb toward $0.0000850–$0.0001100, with occasional surges based on market conditions.
2029
Terra Classic’s long-term outlook remains positive. With continued growth and adoption in the cryptocurrency space, LUNC could reach $0.0001000–$0.0001200 by 2029, reflecting the broader market’s increasing interest in digital assets.
Conclusion
Terra Classic (LUNC) is in a period of volatility but remains positioned for further growth. The token’s technical structure, supported by key moving averages and support levels, suggests that the recent pullback may be temporary, and the uptrend remains intact. If LUNC can break through key resistance levels, it could target $0.0000800 and potentially $0.0001000. However, the coming days will be crucial in determining whether the bullish trend will continue or if a deeper correction is imminent.
With strong market inflows and solid technicals supporting its price action, Terra Classic is positioned for long-term growth. The next few weeks will be vital in determining whether the bullish trend will continue or if deeper corrections are ahead. However, LUNC’s potential for sustained gains makes it a cryptocurrency to watch closely in the coming years.
FAQs
1.Why did LUNC price surge recently?
The recent surge in LUNC’s price was driven by a combination of viral media coverage and strong market inflows, signaling renewed interest in the token.
2. Is LUNC overbought now?
While LUNC has surged, the RSI indicates overbought conditions, suggesting a potential pullback. However, the momentum still favors the bulls in the short term.
3. What is the next key resistance for LUNC?
The immediate resistance for LUNC is between $0.0000650 and $0.0000700. A break above this range could set the stage for further gains.
4. Can LUNC reach $0.0001 by 2025?
Yes, if LUNC maintains its bullish momentum and breaks through key resistance levels, it could reach $0.0001000 by the end of 2025.
5. What is LUNC’s long-term outlook?
LUNC’s long-term outlook remains promising, with strong technical indicators, increased market inflows, and growing adoption. LUNC is poised for continued growth in the coming years.
Also Read: Toncoin (TON) Price Prediction 2025–2029: Can TON Break Above $2.00 Soon?
The post Terra Classic (LUNC) Price Prediction 2025–2029: Will LUNC Hit $0.0001 Soon? appeared first on 36Crypto.
You May Also Like

Nvidia Faces Investor Class Over Misstatements on Crypto Mining Sales

NZD/USD slips as US Dollar strengthens and geopolitical tensions weigh