Pepe (PEPE) jumped to the psychological point at $0.0000050, up by 28% from its November lows. The rebound brought its market cap to over $2.1 billion.Pepe (PEPE) jumped to the psychological point at $0.0000050, up by 28% from its November lows. The rebound brought its market cap to over $2.1 billion.

Pepe Coin price eyes rebound as 15 trillion tokens leave exchanges

2025/12/10 02:55

Pepe Coin price rebounded to its highest point in three weeks as signs of accumulation emerged and as Bitcoin and other altcoins rebounded ahead of the Federal Reserve interest rate decision.

Summary
  • Pepe Coin price has formed an inverse head-and-shoulders pattern.
  • The token has also moved above the Supertrend indicator.
  • The coin will likely have a bullish breakout as exchange reserves dip.

Pepe (PEPE) jumped to the psychological point at $0.0000050, up by 28% from its November lows. The rebound brought its market cap to over $2.1 billion.

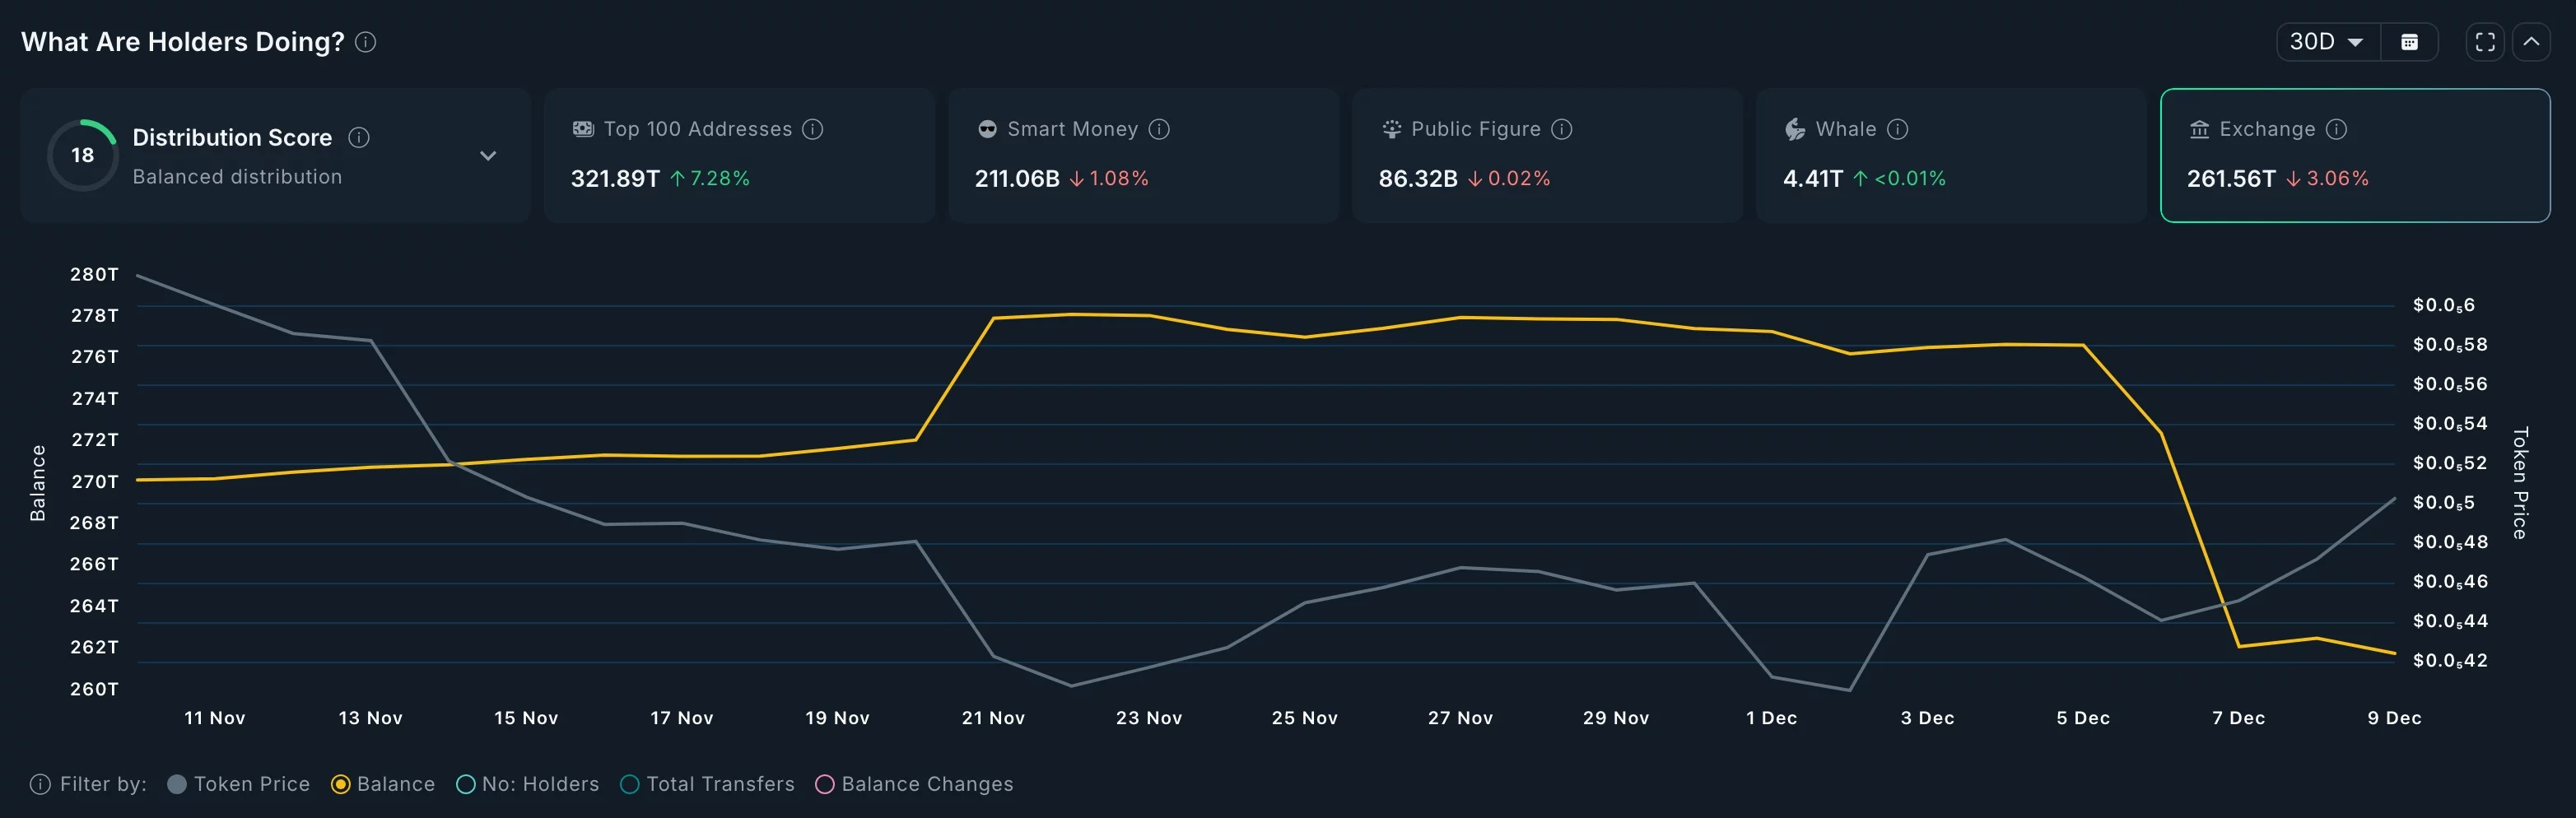
On-chain metrics and technicals suggest that the Pepe Coin price will have a brief rebound in the coming weeks. One of these numbers is that the amount of Pepe tokens in exchanges has nosedived in the past few days.

The supply dropped to 261.6 trillion tokens, down from this month’s high of 276 trillion. This means that over 15 trillion tokens worth over $75 million have been moved to self-custody, which is a bullish sign. This trend coincides with that of other tokens like Chainlink and Shiba Inu.

PEPE exchange balances have dropped

Pepe’s jump is occurring as market participants await the Federal Reserve’s upcoming interest-rate decisions. Ideally, a Federal Reserve cut accompanied by a dovish statement would favor riskier assets such as Pepe and other meme coins. 

Meanwhile, there are signs that the recent decline in Pepe’s futures open interest has bottomed out. CoinGlass data indicate that open interest has been increasing over the past few days. It rose to $255 million today, Dec. 9, from the November low of $174 million. A rebound in open interest would be bullish for Pepe, as it would indicate renewed demand. 

Pepe Coin price technical analysis

Pepe Coin Price

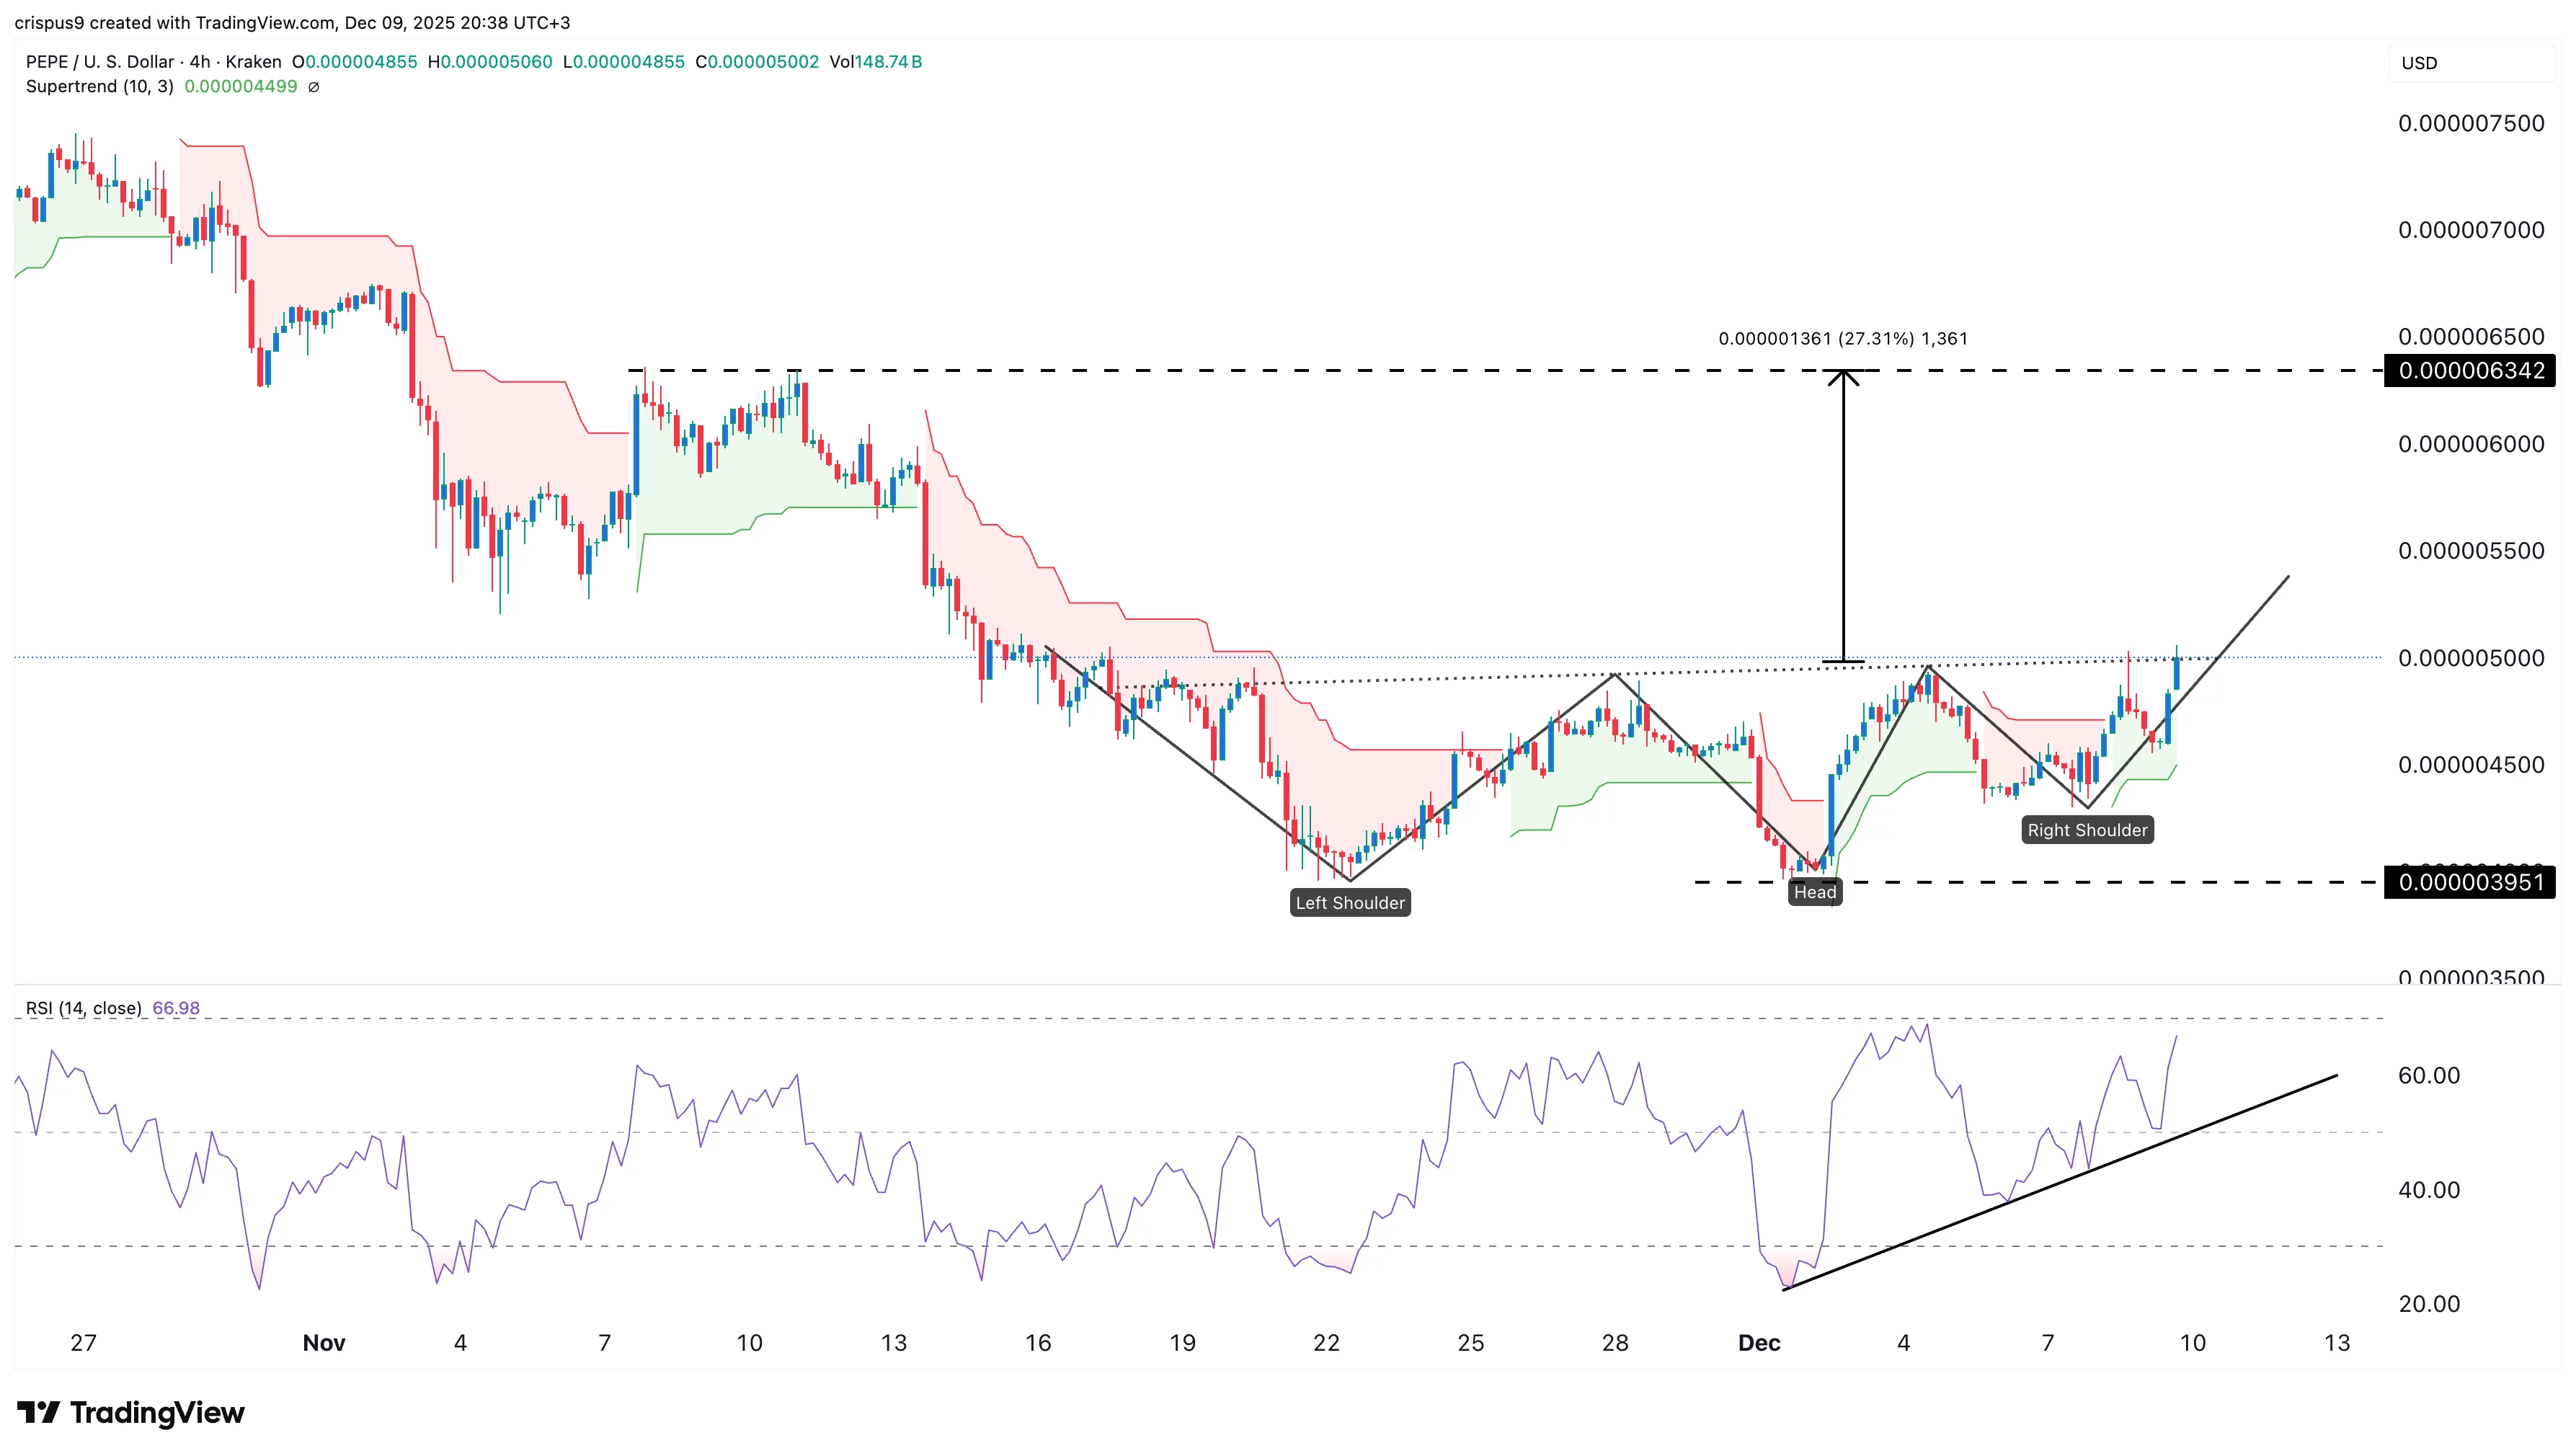
The four-hour chart shows that the Pepe price has crawled back after bottoming at $0.000003950 earlier this month. The coin has moved slightly above the Supertrend indicator, a move that often leads to a rebound.

Pepe has also rallied above the 50-period Exponential Moving Average. It has also formed an inverse head-and-shoulders pattern, a common bullish reversal sign. The Relative Strength Index has continued rising and is nearing the overbought level.

Therefore, the most likely scenario is that it continues to rise, with the next key target at $0.0000063, ~ 27% above the current level. This target coincides with the highest point on Nov. 11. A drop below the right shoulder at $0.0000043 will invalidate the bullish outlook.

Disclaimer: The articles reposted on this site are sourced from public platforms and are provided for informational purposes only. They do not necessarily reflect the views of MEXC. All rights remain with the original authors. If you believe any content infringes on third-party rights, please contact service@support.mexc.com for removal. MEXC makes no guarantees regarding the accuracy, completeness, or timeliness of the content and is not responsible for any actions taken based on the information provided. The content does not constitute financial, legal, or other professional advice, nor should it be considered a recommendation or endorsement by MEXC.

You May Also Like

Standard Chartered: Bitcoin Halving Cycles Are Over

Standard Chartered: Bitcoin Halving Cycles Are Over

The post Standard Chartered: Bitcoin Halving Cycles Are Over appeared on BitcoinEthereumNews.com. Banking giant Standard Chartered believes that Bitcoin’s four-year cycles are already over.  Historically, Bitcoin price movements have been strongly tied to “halving” events (when the block reward for mining Bitcoin is cut in half, roughly every 4 years). Typically, prices would peak about 18 months after a halving. However, Standard Chartered argues that this old logic no longer reliably predicts price cycles following the introduction of Bitcoin ETFs in the U.S.  The rationale is that ETFs make Bitcoin more accessible to mainstream investors. For this new dynamic to be proven, BTC would need to break its current all-time high of $126,000. They expect this breakout could happen in the first half of 2026.  Standard Chartered has also lowered its BTC price predictions for the following years (from $200,000 to $100,000 in 2025, from $300,000 to $200,000 in 2026, from $400,000 to $225,000 in 2027, and from $500,000 to $300,000).  You Might Also Like Bitcoin is currently changing hands at $90,397, according to CoinGecko data.  On the same page  Apart from Standard Chartered, there are quite a few analysts and market watchers who argue that the traditional Bitcoin halving cycle is no longer relevant.  In a recent research note, Bernstein analysts assert that the traditional four‑year halving cycle is effectively over due to Bitcoin ETFs dominating the scene. CryptoQuant CEO Ki Young Ju also claims that the flagship cryptocurrency no longer follows four-year cycles, citing institutional buying power.  That said, it remains to be seen whether BTC will be able to reclaim its current all-time high next year.  Source: https://u.today/standard-chartered-bitcoin-halving-cycles-are-over
Share
BitcoinEthereumNews2025/12/10 02:46