

Dogecoin (DOGE) Price: Three Signals Point to Higher Levels Ahead
TLDR
- Dogecoin price trades at $0.1454 with a weekly MACD bullish crossover pattern forming on the chart
- The memecoin defends the $0.13-$0.15 support zone that has held through 2024 and 2025
- Dogecoin ETF records $3.23 million in daily trading volume since launch
- Exchange outflows between $20 million and $60 million show strong accumulation activity
- Technical targets include $0.18-$0.20 initially, with $0.30 as the broader resistance level
Dogecoin continues to hold above the $0.13 support level as technical patterns shift in favor of buyers. The price currently trades at $0.1454 after declining 1.72% in the past 24 hours.
 Dogecoin (DOGE) Price
A weekly MACD bullish crossover has formed on the chart. The MACD line crossed above the signal line while the price held above $0.14. Green histogram bars are increasing in size with each new print. This pattern typically appears when buying momentum begins to build after a period of weakness.
The memecoin has defended the $0.13 to $0.15 support zone multiple times since early 2024. Each test of this area has produced strong rebounds with smaller lower wicks on the candles. Bodies are printing higher during recent sessions. The 50-week and 200-week moving averages remain above current price levels.
Buyers respond quickly at the $0.135 level whenever price returns to that point. Downward moves lose strength as price compresses near the lower boundary of the trading channel. The pivot point sits at $0.150. A break above $0.155 opens the path toward $0.181.
ETF Activity Reaches $3.23 Million
The Dogecoin ETF has generated $3.23 million in daily trading volume since its launch. This figure represents institutional-style participation in the asset. The ETF has been described as one of the better-performing products in its category.
The trading volume adds to the existing spot market activity. Spot Taker CVD has risen on steady buying pressure. The gradient shows consistent accumulation without sharp spikes or drops. This indicates deliberate positioning by active traders.
Exchange Outflows Show Accumulation Pattern
Data from Coinglass reveals consistent outflows from exchanges. The outflows range between $20 million and $60 million during recent periods. Large holders are moving coins off exchanges despite the price dropping from $0.30 to current levels.
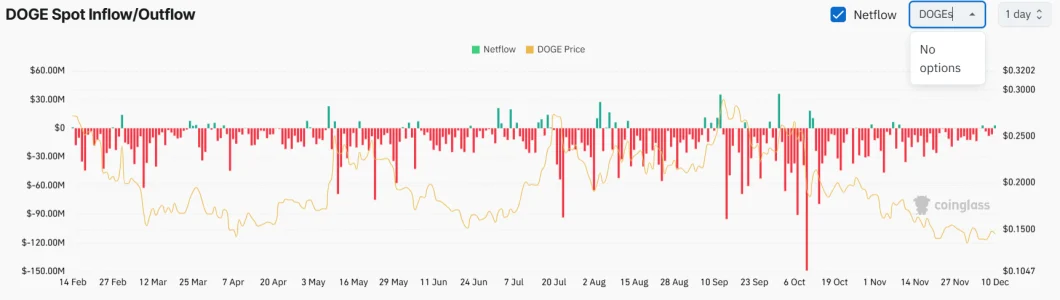 Source: Coinglass
These outflows have stayed above average daily volume. The pattern suggests accumulation is happening while price remains weak. Fewer coins on exchanges typically means reduced selling pressure. The trend has continued even as price consolidated in the lower range.
The Relative Strength Index sits between 39 and 46 on the weekly timeframe. This range indicates neutral momentum without overbought or oversold conditions. Price remains in a stable position within the established support zone.
Technical targets extend to $0.18-$0.20 as the first resistance area. Above that level, the next zone sits at $0.210. Continued movement higher leads to $0.270 before reaching the broader $0.30 target. Each level represents a previous point where selling pressure increased.
The current setup combines technical crossover patterns with rising ETF volume and negative exchange netflows. Buyers protect the lower support levels while sellers have not pushed price to new lows. The structure has improved across short-term cycles as compression narrows near the end of December.
The post Dogecoin (DOGE) Price: Three Signals Point to Higher Levels Ahead appeared first on CoinCentral.


You May Also Like

Things To Do In Hoi An (2026): 15 Best Activities & Travel Guide

Why XRP Price is Outperforming Bitcoin and Ethereum This Week?


