Yesterday’s bullish pressure went off, and currently, the bears have taken charge back within the crypto market. The tokens are stuck in indecision, bouncing between gains and losses without a clear direction. The largest asset, Bitcoin (BTC), has fallen to the $90.2K zone, and the largest altcoin, Ethereum (ETH), slippedYesterday’s bullish pressure went off, and currently, the bears have taken charge back within the crypto market. The tokens are stuck in indecision, bouncing between gains and losses without a clear direction. The largest asset, Bitcoin (BTC), has fallen to the $90.2K zone, and the largest altcoin, Ethereum (ETH), slipped

OFFICIAL TRUMP (TRUMP) Takes a Hit: Can It Hold Its Ground or Test Lower Lows?

2025/12/11 14:33
  • OFFICIAL TRUMP (TRUMP) is trading at $5.
  • Daily trading volume has dropped by 28%.

Yesterday’s bullish pressure went off, and currently, the bears have taken charge back within the crypto market. The tokens are stuck in indecision, bouncing between gains and losses without a clear direction. The largest asset, Bitcoin (BTC), has fallen to the $90.2K zone, and the largest altcoin, Ethereum (ETH), slipped to the $3.2K mark.

Among the assets, the momentum of the OFFICIAL TRUMP (TRUMP) price has lost by over 4.03% in the last 24 hours. The asset opened the day trading at around $5.91, and with the bearish command, the TRUMP price fell toward a low range of $5.61. If the active momentum sustains, the asset would see more losses. 

As per CoinMarketCap data, at the time of writing, the OFFICIAL TRUMP is trading within the $5.64 level. With the asset’s market cap resting at $1.13 billion, the daily trading volume of TRUMP has plummeted by over 28.08%, reaching the $241.19 million zone. 

Will OFFICIAL TRUMP Keep Dropping, or Is a Rebound Loading?

The technical analysis of OFFICIAL TRUMP exhibits a bearish zone, with the Moving Average Convergence Divergence (MACD) line and the signal line settled below the zero line. This indicates that downward momentum has been dominant for a while, and the buyers have not yet regained control.

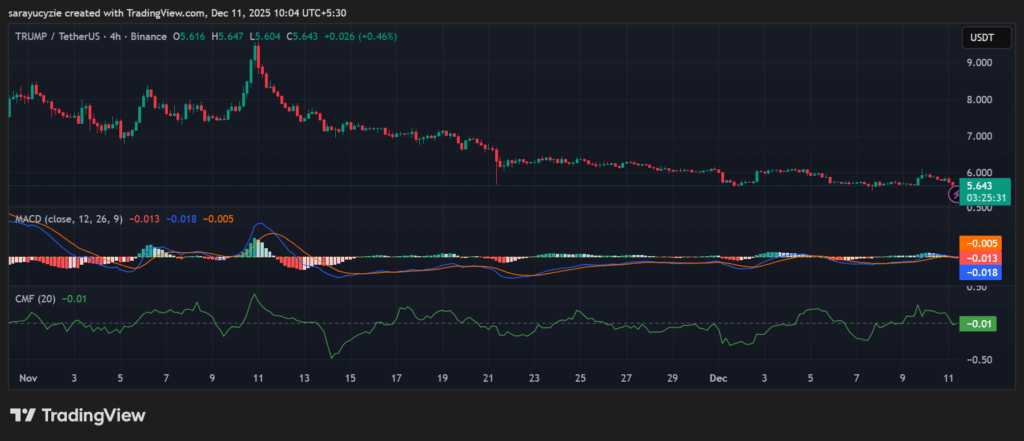
TRUMP chart (Source: TradingView)

Moreover, the Chaikin Money Flow (CMF) indicator found at -0.01 is slightly negative, reflecting a neutral-to-weak market trend. It suggests mild selling pressure in the TRUMP market. It is not strongly bearish, but the sellers have a slight upper hand. Significantly, capital is flowing out of the asset.

OFFICIAL TRUMP’s four-hour bearish trading pattern might push the price down to the $5.57 support level. With the downside correction gaining traction, the potential bears could trigger the emergence of the death cross, and gradually retrace to its former low below $5.50. 

Assuming a reversal of the momentum, the TRUMP price could instantly move upward and find the resistance at the $5.71 range. A further correction on the upside might initiate the formation of the golden cross, which likely sends the asset’s price toward a high of $5.78.

The daily Relative Strength Index (RSI) at 40.67 signals TRUMP’s neutral-to-slightly bearish zone. It is not oversold, but it is leaning towards the lower side. A move toward 30 may increase bearish pressure, while a rebound to 50 strengthens buyer momentum. Besides, OFFICIAL TRUMP’s Bull Bear Power (BBP) of -0.233 implies that bears have a slight upper hand. As the value is close to zero, the bearish momentum is not strong enough, but it indicates weak buying strength.

Top Updated Crypto News

Gemini Receives CFTC License for US Prediction Markets

Disclaimer: The articles reposted on this site are sourced from public platforms and are provided for informational purposes only. They do not necessarily reflect the views of MEXC. All rights remain with the original authors. If you believe any content infringes on third-party rights, please contact service@support.mexc.com for removal. MEXC makes no guarantees regarding the accuracy, completeness, or timeliness of the content and is not responsible for any actions taken based on the information provided. The content does not constitute financial, legal, or other professional advice, nor should it be considered a recommendation or endorsement by MEXC.

You May Also Like

Edges higher ahead of BoC-Fed policy outcome

Edges higher ahead of BoC-Fed policy outcome

The post Edges higher ahead of BoC-Fed policy outcome appeared on BitcoinEthereumNews.com. USD/CAD gains marginally to near 1.3760 ahead of monetary policy announcements by the Fed and the BoC. Both the Fed and the BoC are expected to lower interest rates. USD/CAD forms a Head and Shoulder chart pattern. The USD/CAD pair ticks up to near 1.3760 during the late European session on Wednesday. The Loonie pair gains marginally ahead of monetary policy outcomes by the Bank of Canada (BoC) and the Federal Reserve (Fed) during New York trading hours. Both the BoC and the Fed are expected to cut interest rates amid mounting labor market conditions in their respective economies. Inflationary pressures in the Canadian economy have cooled down, emerging as another reason behind the BoC’s dovish expectations. However, the Fed is expected to start the monetary-easing campaign despite the United States (US) inflation remaining higher. Investors will closely monitor press conferences from both Fed Chair Jerome Powell and BoC Governor Tiff Macklem to get cues about whether there will be more interest rate cuts in the remainder of the year. According to analysts from Barclays, the Fed’s latest median projections for interest rates are likely to call for three interest rate cuts by 2025. Ahead of the Fed’s monetary policy, the US Dollar Index (DXY), which tracks the Greenback’s value against six major currencies, holds onto Tuesday’s losses near 96.60. USD/CAD forms a Head and Shoulder chart pattern, which indicates a bearish reversal. The neckline of the above-mentioned chart pattern is plotted near 1.3715. The near-term trend of the pair remains bearish as it stays below the 20-day Exponential Moving Average (EMA), which trades around 1.3800. The 14-day Relative Strength Index (RSI) slides to near 40.00. A fresh bearish momentum would emerge if the RSI falls below that level. Going forward, the asset could slide towards the round level of…
Share
BitcoinEthereumNews2025/09/18 01:23