Bitcoin (BTC) Risks Dump to $80K as Bulls Fail to Clear This Key Barrier
Bitcoin (BTC) has fallen nearly 30% from its October high of over $126,000 and is trading around $86,500 at press time. The asset is moving sideways after a sharp drop earlier in the month.
Despite small bounces, there’s no clear sign of a trend reversal yet. The focus now is on whether Bitcoin can break above $88,000. If not, the move toward lower levels may continue.
$88K Stands as the Line to Beat
Analyst Michaël van de Poppe noted that BTC is currently undecided, consolidating between support and resistance zones.
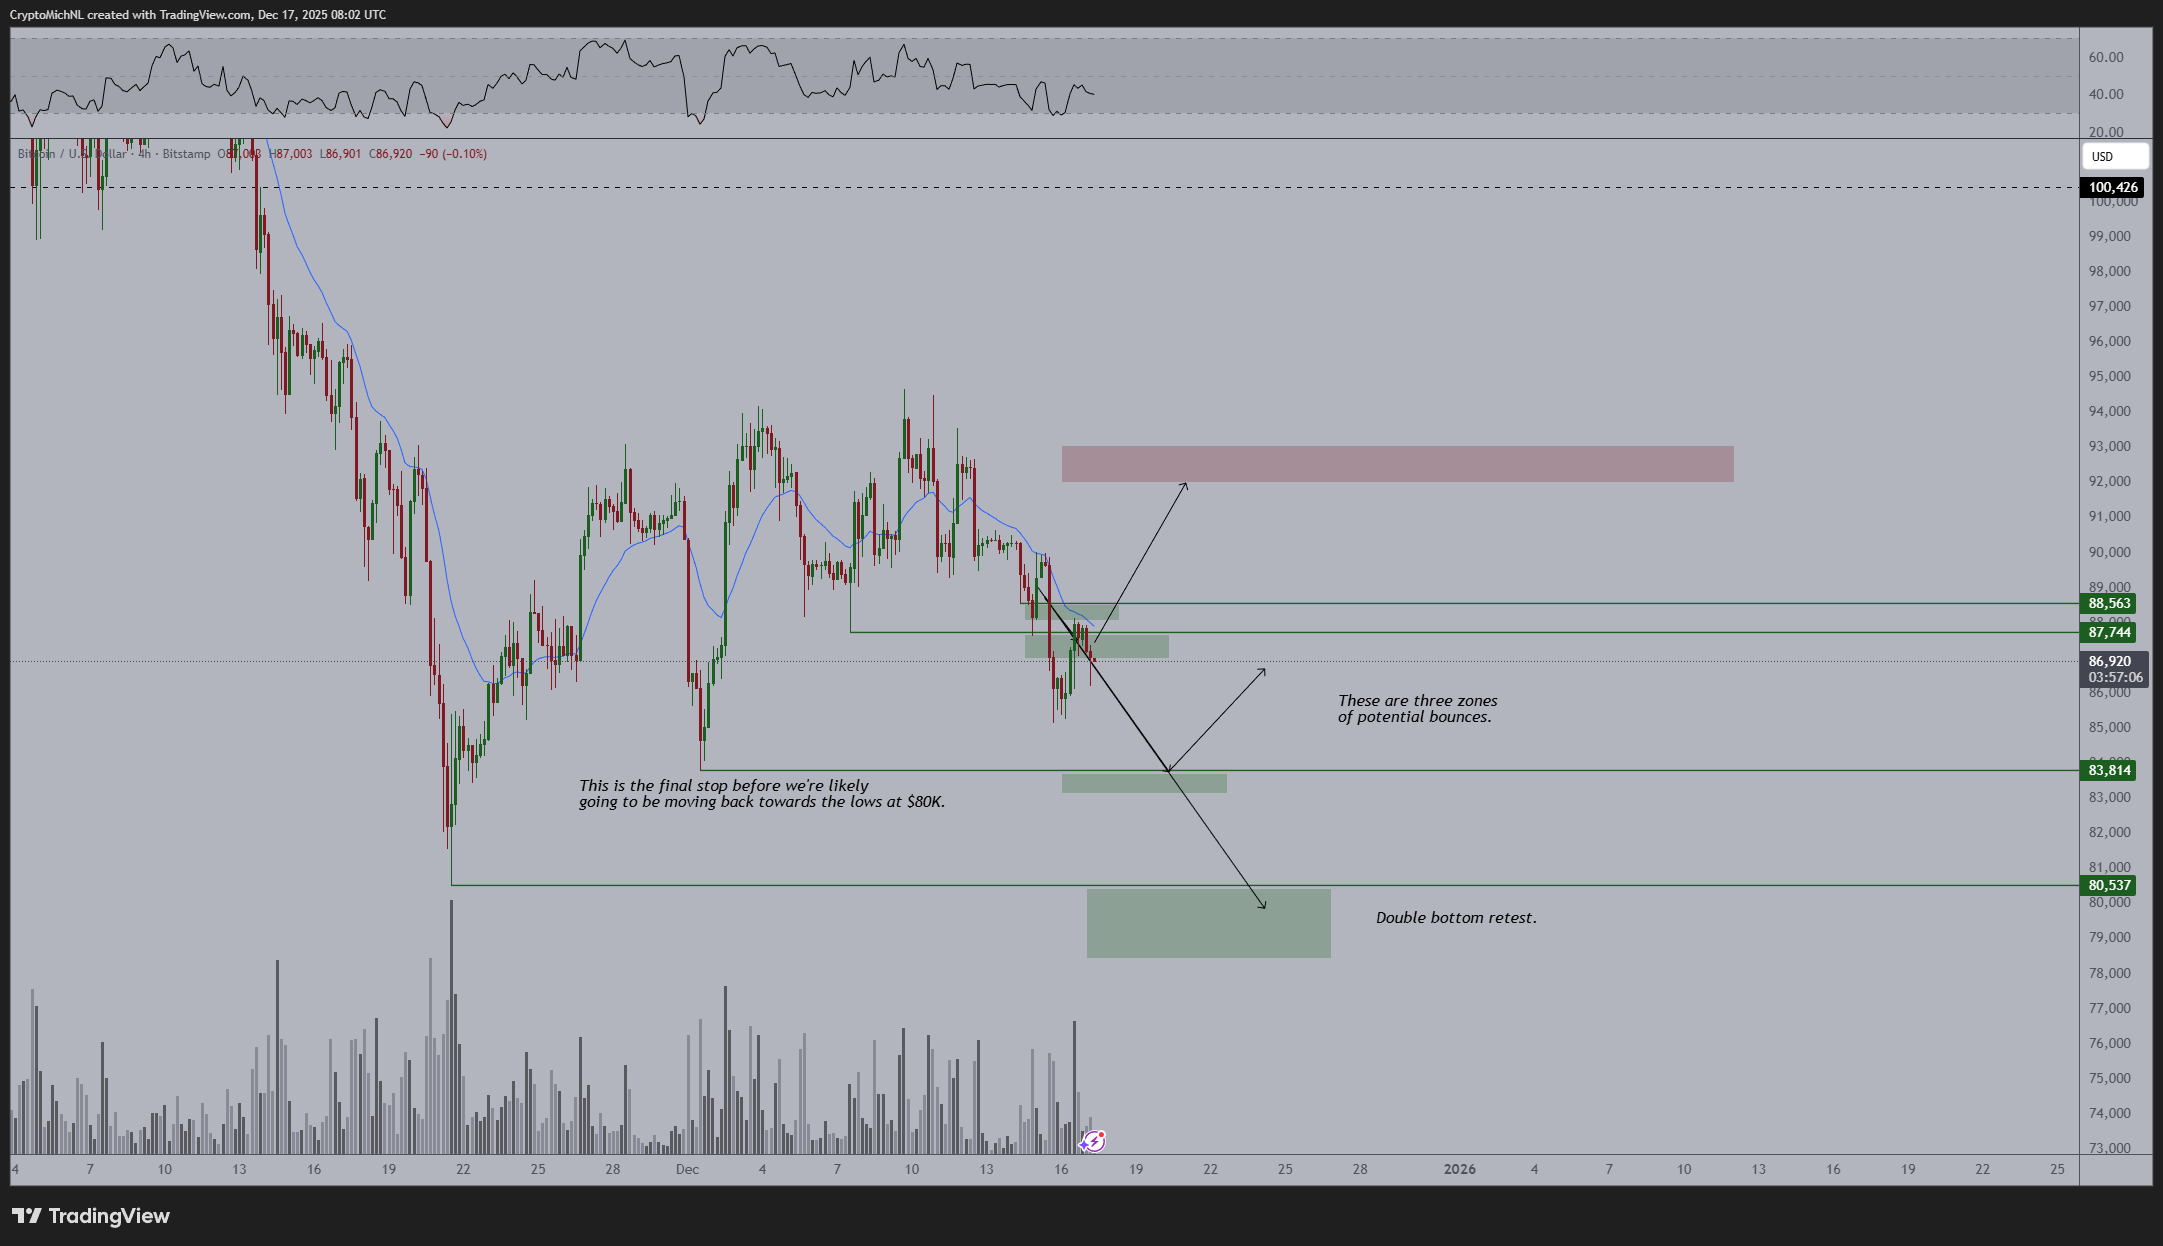 Bitcoin (BTC) Price Chart 17.12. Source: Michaël van de Poppe/X
This week, Bitcoin briefly touched $88,000 before falling back toward $87,500. The 7-day range between $85,100 and $93,000 reflects uncertain movement. With no clear breakout, the lower areas near $83,000 and $80,000 are starting to draw attention.
Kamran Asghar, another analyst, believes Bitcoin is searching for a new base after breaking below a long-standing support line. He marked $86,500 as a possible short-term floor, but warned that deeper levels may be tested. He pointed to a zone between $72,000 and $75,000 that hasn’t been touched since the 2024 breakout.
That area, often referred to by traders as a key demand zone, could offer support if the decline continues. If the current range breaks, Bitcoin may move toward that lower target range.
Long-Term Trend Break Raises Concern
Bitcoin has now lost the Supertrend support on the weekly chart for the first time since January 2023. According to a post by Bitcoinsensus, this marks the first major break of structure since the bull cycle began, adding weight to the bearish sentiment currently in play. Adding to this, long-term holders are starting to exit their positions.
This shift adds to the selling pressure and reduces the strength of any bounce attempts.
Moreover, the drop in Bitcoin’s price over recent days is being linked to liquidations across leverage-heavy positions.
The move reflects a flush of excess leverage rather than weakness in underlying demand. As CryptoPotato recently reported, current selling pressure is still stronger than demand. Until that changes, price recovery may be limited, and further downside cannot be ruled out.
The post Bitcoin (BTC) Risks Dump to $80K as Bulls Fail to Clear This Key Barrier appeared first on CryptoPotato.


You May Also Like

Early Ozak AI Participants at $0.014 Could Be Positioned for Multi-Hundred-X Returns if Long-Term Targets Hold

Dow Jones futures plunge as risk aversion increases after Trump’s comments