ULTIMA Plummets 4.76%: Is This the End of the Bull Run? Find Out Now!
- ULTIMA drops 4.76% as market faces uncertain future.
- Traders uncertain as ULTIMA/USDT shows no clear momentum shift.
- Bollinger Bands and RSI suggest market indecision for ULTIMA/USDT.
The ULTIMA trading pair has faced a sharp downturn, dropping 4.76% in the latest trading session. After reaching a high of $5,684.36, the price of ULTIMA has significantly pulled back, now standing at $5,390.60. Traders are left questioning if this marks the end of the recent bullish momentum.
Earlier, the market witnessed a surge, with the price of ULTIMA soaring to impressive highs, giving hope to those in favor of an extended bull run. However, the excitement was short-lived as the market quickly corrected, leading to the current decline.
Also Read: Exodus and MoonPay to Launch Game-Changing US Dollar Stablecoin for Easy Payments
Is Market Sentiment Shifting? Key Indicators Point to Neutrality
Analyzing the Bollinger Bands reveals a potential pause in the upward trend. The price is now hovering near the middle band, which is the 20-day simple moving average (SMA) at $5,481.53. This middle band typically represents a balanced market, with the price neither too high nor too low. The upper band stands at $7,095.45, and the lower band is at $3,867.62, showing the potential volatility in the market.
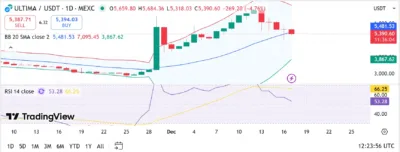
Source: Tradingview
The Relative Strength Index (RSI) supports this neutral market view, currently sitting at 53.28. With an RSI in the middle range, neither overbought nor oversold conditions are present, suggesting a lack of clear momentum. Traders may be in a holding pattern, waiting for a breakout or breakdown to signal the next move.
Can ULTIMA Rebound, or Is a Further Drop Imminent?
The 4.76% drop in ULTIMA has sparked fears that the bullish run may be over. Currently, the price is at a critical juncture. The price is resting near the middle of the Bollinger Bands, indicating that it could go either way. Without a strong indication of upward momentum, traders are wary of further losses.
As of now, market sentiment remains cautious. The lack of strong buying or selling pressure reflected in the RSI suggests that the market is undecided. Traders will continue to monitor the 20-day SMA for potential signs of a breakout, but until then, the market remains in a consolidation phase.
ULTIMA price action leaves many traders wondering if the bullish run is truly over, or if the market will find new support levels to bounce back from. Time will tell whether this is just a temporary correction or the beginning of a deeper downtrend.
Also Read: Binance Cracks Down on Fraudulent Listing Agents, Blacklists Multiple Entities
The post ULTIMA Plummets 4.76%: Is This the End of the Bull Run? Find Out Now! appeared first on 36Crypto.
You May Also Like

Dogecoin and Hyperliquid Are Heating Up — But This New Project Might Be the One to Watch

‘Scream 7’ Is Now Streaming—How To Watch The Horror Hit Sequel At Home