Data shows traders have set up fresh Bitcoin positions on the perpetual futures market during the past day, and the Funding Rate suggests they are long bets. BitcoinData shows traders have set up fresh Bitcoin positions on the perpetual futures market during the past day, and the Funding Rate suggests they are long bets. Bitcoin

Bitcoin Perps Heat Up Again As Leveraged Longs Rise

2025/12/23 16:00

Data shows traders have set up fresh Bitcoin positions on the perpetual futures market during the past day, and the Funding Rate suggests they are long bets.

Bitcoin Open Interest Has Witnessed An Uptick

According to data from on-chain analytics firm Glassnode, the surge Bitcoin has seen to kick off Monday has come alongside a spike in the Bitcoin perpetual futures Open Interest.

The “Open Interest” refers to an indicator that keeps track of the total amount of BTC perpetual futures positions that are currently open on all derivatives exchanges.

When the value of this metric rises, it means the investors are opening up fresh positions on the market. Since such a trend usually accompanies an increase in leverage for the sector, it can lead to more volatility for the asset.

On the other hand, the indicator going down implies investors are either pulling back on risk or getting liquidated by their platform. This kind of trend can result in the cryptocurrency’s price behaving in a more stable manner.

Now, here is a chart that shows the trend in the Bitcoin Open Interest over the last couple of weeks:

Bitcoin Open Interest

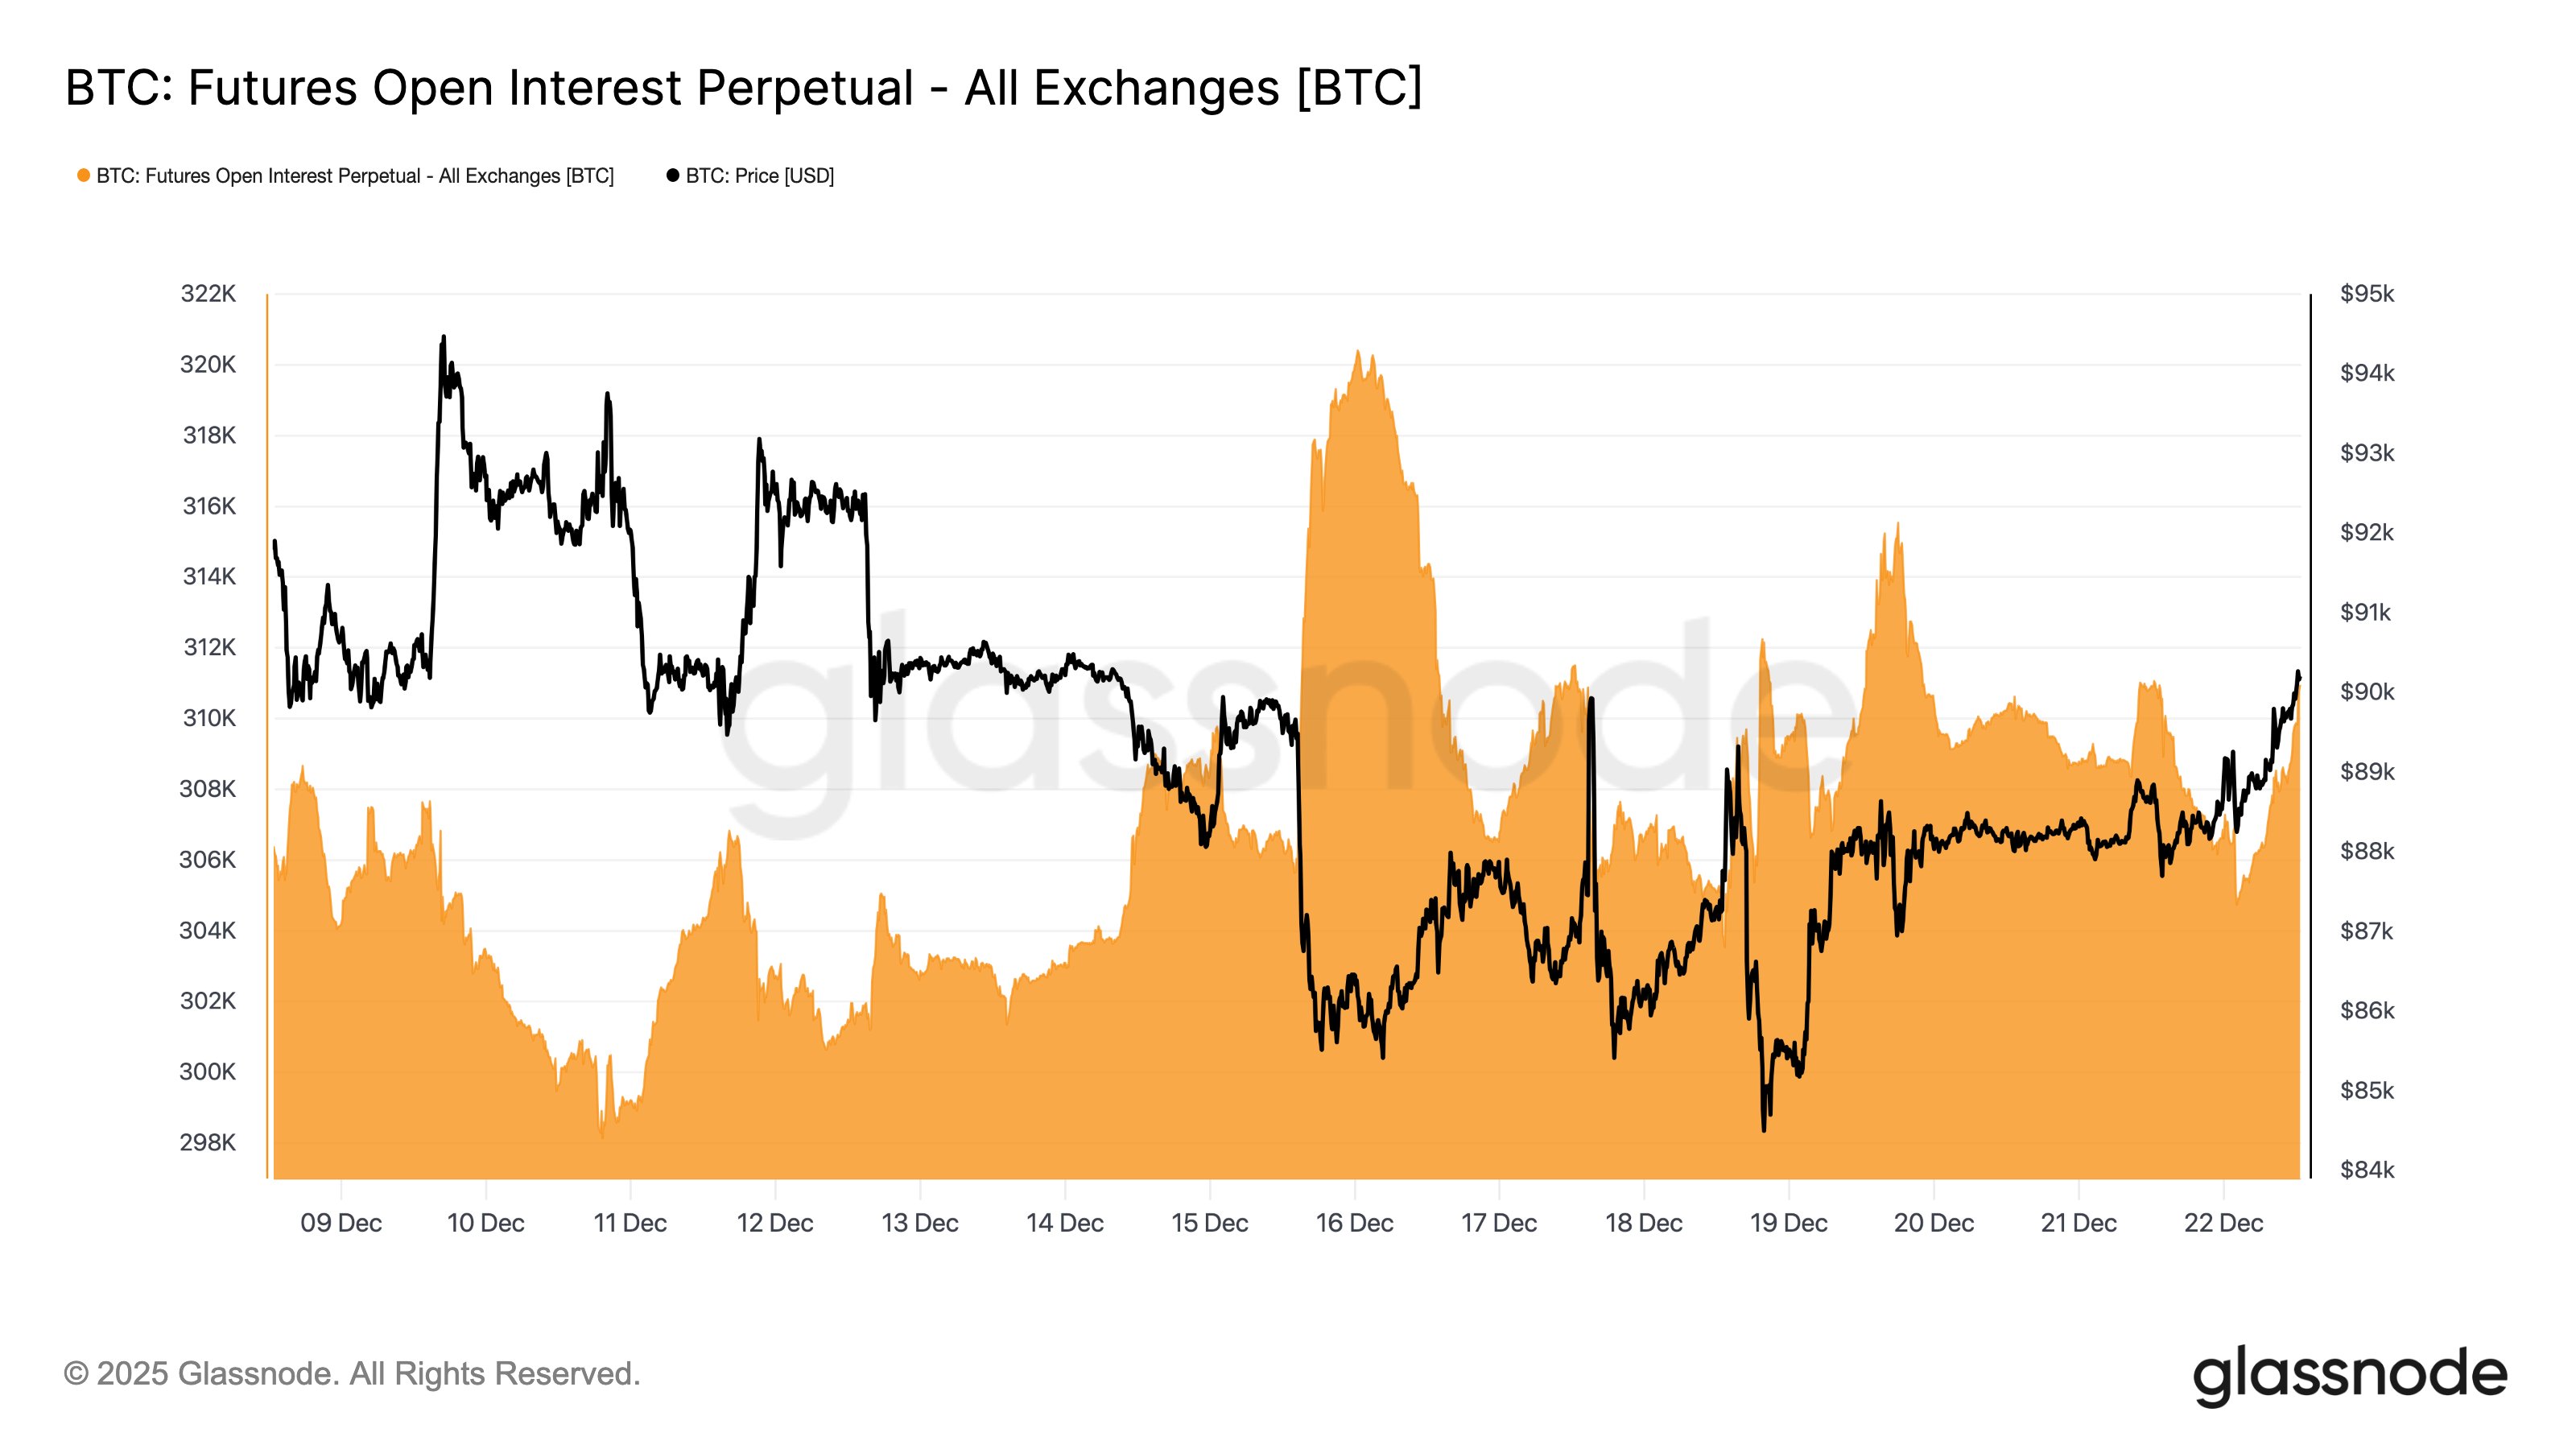
As displayed in the above graph, the Bitcoin Open Interest rose from 304,000 BTC to 310,000 BTC as the cryptocurrency observed a recovery surge to $90,000 during the past day.

This represents an increase of about 2%, which isn’t much, but still signals that the rally encouraged traders to open up new positions on the perpetual futures market.

The Open Interest includes both types of positions when calculating its value, so it contains no information about whether positions have a bias toward shorts or longs. Another metric called the Funding Rate can be used to determine that instead.

This indicator measures the amount of periodic fee that perpetual futures traders are exchanging between each other. A positive value implies long investors are paying a premium to the shorts in order to hold onto their positions, while a negative one implies bearish bets are dominant.

As the below chart shows, the Bitcoin Funding Rate has been positive for much of the last two weeks, indicating that a bullish sentiment has been shared by the majority of perpetual futures traders.

Bitcoin Funding Rate

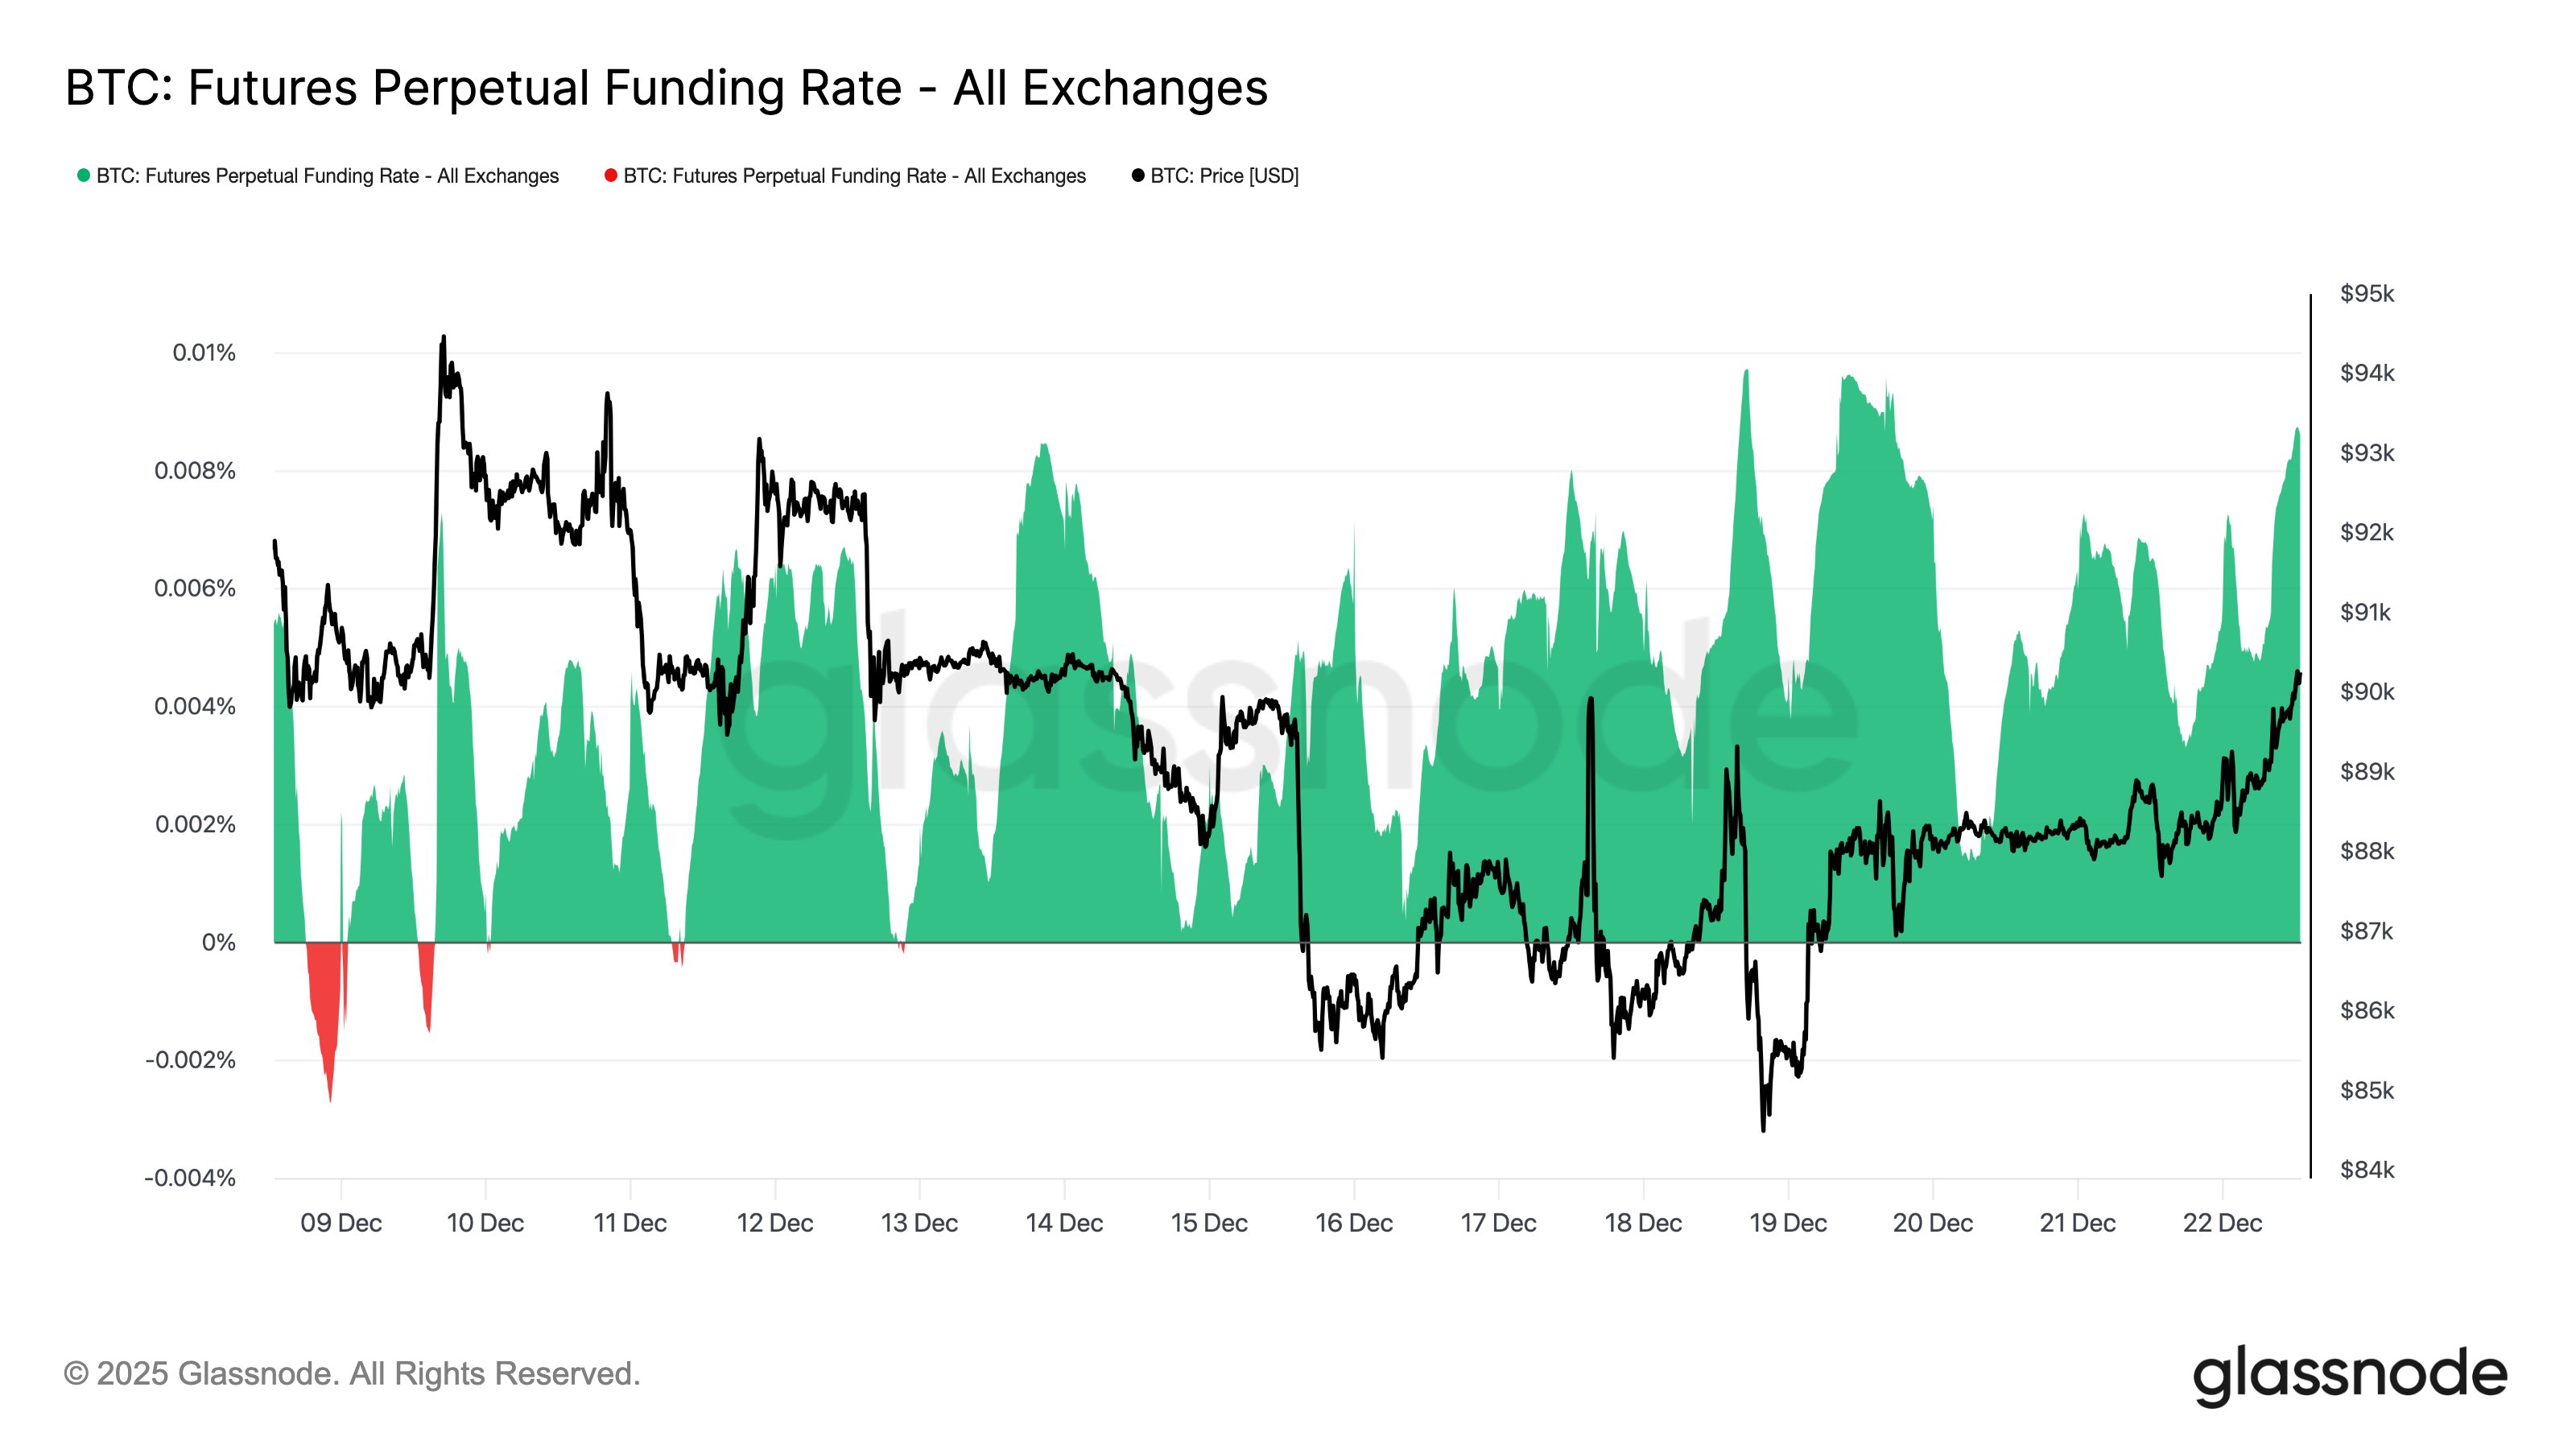
This metric also noted an uptick alongside the increase in the Open Interest, going from 0.04% to 0.09%. “This combination signals a renewed buildup in leveraged long positioning, as perpetual traders position for a potential year-end move,” noted Glassnode.

BTC Price

Bitcoin has seen a bit of a pullback since its surge above $90,000 as its price is now back at $89,500.

Market Opportunity
RISE Logo
RISE Price(RISE)
$0,005393
$0,005393$0,005393
-0,12%
USD
RISE (RISE) Live Price Chart
Disclaimer: The articles reposted on this site are sourced from public platforms and are provided for informational purposes only. They do not necessarily reflect the views of MEXC. All rights remain with the original authors. If you believe any content infringes on third-party rights, please contact service@support.mexc.com for removal. MEXC makes no guarantees regarding the accuracy, completeness, or timeliness of the content and is not responsible for any actions taken based on the information provided. The content does not constitute financial, legal, or other professional advice, nor should it be considered a recommendation or endorsement by MEXC.

You May Also Like

XRP faces far more negative social media commentary than average

XRP faces far more negative social media commentary than average

The post XRP faces far more negative social media commentary than average appeared on BitcoinEthereumNews.com. XRP is drawing unusually high levels of negative
Share
BitcoinEthereumNews2025/12/23 19:23
Xcimer Energy Delivers Technical Update to U.S. Energy Sec. Chris Wright and U.S. Rep. Gabe Evans in Denver Laser Bay

Xcimer Energy Delivers Technical Update to U.S. Energy Sec. Chris Wright and U.S. Rep. Gabe Evans in Denver Laser Bay

High-level visit, also including Chancellor of Colorado State University System Dr. Tony Frank, comes after Xcimer begins testing of one of the highest-energy KrF
Share
AI Journal2025/12/23 19:16
Crucial US Stock Market Update: What Wednesday’s Mixed Close Reveals

Crucial US Stock Market Update: What Wednesday’s Mixed Close Reveals

BitcoinWorld Crucial US Stock Market Update: What Wednesday’s Mixed Close Reveals The financial world often keeps us on our toes, and Wednesday was no exception. Investors watched closely as the US stock market concluded the day with a mixed performance across its major indexes. This snapshot offers a crucial glimpse into current investor sentiment and economic undercurrents, prompting many to ask: what exactly happened? Understanding the Latest US Stock Market Movements On Wednesday, the closing bell brought a varied picture for the US stock market. While some indexes celebrated gains, others registered slight declines, creating a truly mixed bag for investors. The Dow Jones Industrial Average showed resilience, climbing by a notable 0.57%. This positive movement suggests strength in some of the larger, more established companies. Conversely, the S&P 500, a broader benchmark often seen as a barometer for the overall market, experienced a modest dip of 0.1%. The technology-heavy Nasdaq Composite also saw a slight retreat, sliding by 0.33%. This particular index often reflects investor sentiment towards growth stocks and the tech sector. These divergent outcomes highlight the complex dynamics currently at play within the American economy. It’s not simply a matter of “up” or “down” for the entire US stock market; rather, it’s a nuanced landscape where different sectors and company types are responding to unique pressures and opportunities. Why Did the US Stock Market See Mixed Results? When the US stock market delivers a mixed performance, it often points to a tug-of-war between various economic factors. Several elements could have contributed to Wednesday’s varied closings. For instance, positive corporate earnings reports from certain industries might have bolstered the Dow. At the same time, concerns over inflation, interest rate policies by the Federal Reserve, or even global economic uncertainties could have pressured growth stocks, affecting the S&P 500 and Nasdaq. Key considerations often include: Economic Data: Recent reports on employment, manufacturing, or consumer spending can sway market sentiment. Corporate Announcements: Strong or weak earnings forecasts from influential companies can significantly impact their respective sectors. Interest Rate Expectations: The prospect of higher or lower interest rates directly influences borrowing costs for businesses and consumer spending, affecting future profitability. Geopolitical Events: Global tensions or trade policies can introduce uncertainty, causing investors to become more cautious. Understanding these underlying drivers is crucial for anyone trying to make sense of daily market fluctuations in the US stock market. Navigating Volatility in the US Stock Market A mixed close, while not a dramatic downturn, serves as a reminder that market volatility is a constant companion for investors. For those involved in the US stock market, particularly individuals managing their portfolios, these days underscore the importance of a well-thought-out strategy. It’s important not to react impulsively to daily movements. Instead, consider these actionable insights: Diversification: Spreading investments across different sectors and asset classes can help mitigate risk when one area underperforms. Long-Term Perspective: Focusing on long-term financial goals rather than short-term gains can help weather daily market swings. Stay Informed: Keeping abreast of economic news and company fundamentals provides context for market behavior. Consult Experts: Financial advisors can offer personalized guidance based on individual risk tolerance and objectives. Even small movements in major indexes can signal shifts that require attention, guiding future investment decisions within the dynamic US stock market. What’s Next for the US Stock Market? Looking ahead, investors will be keenly watching for further economic indicators and corporate announcements to gauge the direction of the US stock market. Upcoming inflation data, statements from the Federal Reserve, and quarterly earnings reports will likely provide more clarity. The interplay of these factors will continue to shape investor confidence and, consequently, the performance of the Dow, S&P 500, and Nasdaq. Remaining informed and adaptive will be key to understanding the market’s trajectory. Conclusion: Wednesday’s mixed close in the US stock market highlights the intricate balance of forces influencing financial markets. While the Dow showed strength, the S&P 500 and Nasdaq experienced slight declines, reflecting a nuanced economic landscape. This reminds us that understanding the ‘why’ behind these movements is as important as the movements themselves. As always, a thoughtful, informed approach remains the best strategy for navigating the complexities of the market. Frequently Asked Questions (FAQs) Q1: What does a “mixed close” mean for the US stock market? A1: A mixed close indicates that while some major stock indexes advanced, others declined. It suggests that different sectors or types of companies within the US stock market are experiencing varying influences, rather than a uniform market movement. Q2: Which major indexes were affected on Wednesday? A2: On Wednesday, the Dow Jones Industrial Average gained 0.57%, while the S&P 500 edged down 0.1%, and the Nasdaq Composite slid 0.33%, illustrating the mixed performance across the US stock market. Q3: What factors contribute to a mixed stock market performance? A3: Mixed performances in the US stock market can be influenced by various factors, including specific corporate earnings, economic data releases, shifts in interest rate expectations, and broader geopolitical events that affect different market segments uniquely. Q4: How should investors react to mixed market signals? A4: Investors are generally advised to maintain a long-term perspective, diversify their portfolios, stay informed about economic news, and avoid impulsive decisions. Consulting a financial advisor can also provide personalized guidance for navigating the US stock market. Q5: What indicators should investors watch for future US stock market trends? A5: Key indicators to watch include upcoming inflation reports, statements from the Federal Reserve regarding monetary policy, and quarterly corporate earnings reports. These will offer insights into the future direction of the US stock market. Did you find this analysis of the US stock market helpful? Share this article with your network on social media to help others understand the nuances of current financial trends! To learn more about the latest stock market trends, explore our article on key developments shaping the US stock market‘s future performance. This post Crucial US Stock Market Update: What Wednesday’s Mixed Close Reveals first appeared on BitcoinWorld.
Share
Coinstats2025/09/18 05:30