Hedera (HBAR) price continues to trade under sustained downside pressure, with technical signals pointing to an elevated risk of capitulation if key support levelsHedera (HBAR) price continues to trade under sustained downside pressure, with technical signals pointing to an elevated risk of capitulation if key support levels

HBAR price shows early capitulation warning as downtrend persists

2025/12/24 01:32
3 min read
For feedback or concerns regarding this content, please contact us at crypto.news@mexc.com

HBAR price trades under heavy selling pressure as bearish structure holds firm, placing the $0.11 support at risk and increasing the probability of a capitulation-style move lower.

Summary
  • Selling pressure continues to outweigh demand across higher time frames
  • Key volume-based support levels have failed to hold
  • Price reaction at $0.11 will likely define near-term direction

Hedera (HBAR) price continues to trade under sustained downside pressure, with technical signals pointing to an elevated risk of capitulation if key support levels fail to hold. Price action remains firmly bearish, characterized by consecutive lower highs and lower lows since the loss of the Value Area High.

With HBAR now hovering near a critical high-time-frame support at $0.11, the market appears increasingly vulnerable to an accelerated downside move should this level give way.

HBAR price key technical points

  • Bearish market structure remains intact, with lower highs and lower lows.
  • Price confirms bearish retest of the Point of Control, signaling acceptance below value.
  • $0.11 high-time-frame support is under threat, with limited support below.
HBAR price shows early capitulation warning as downtrend persists - 1

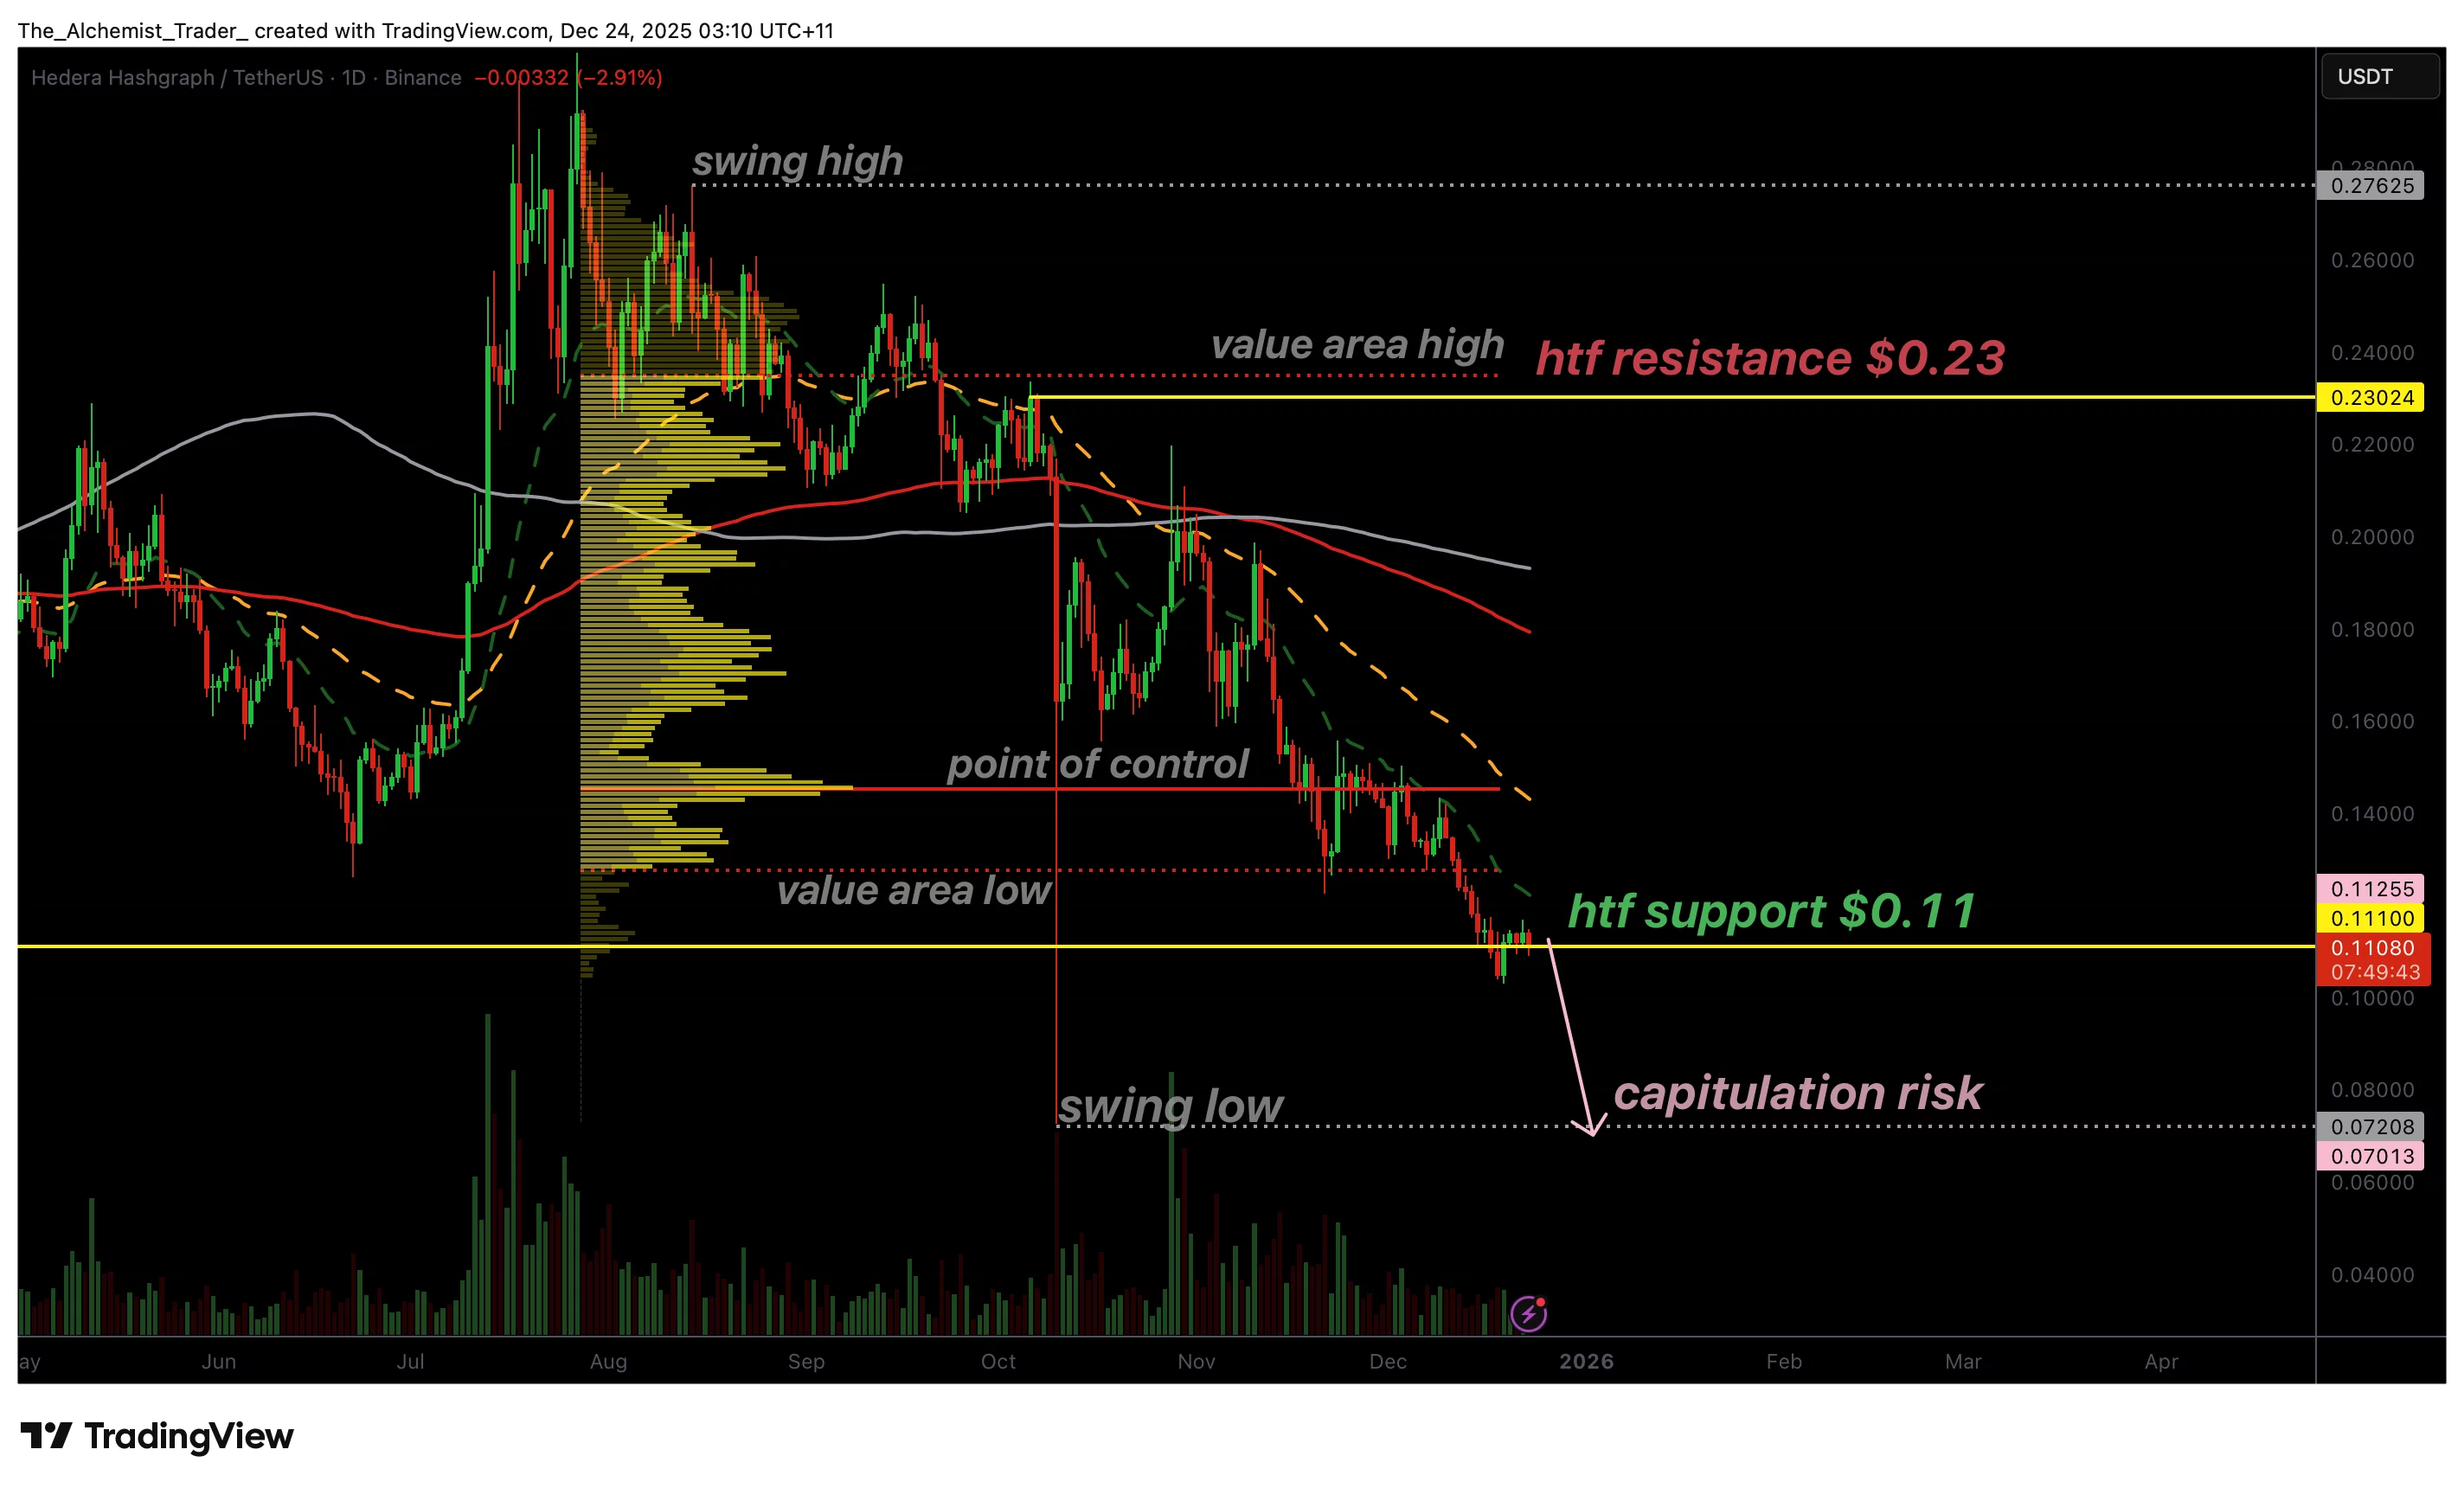
HBAR’s recent price action reflects a market firmly controlled by sellers. The downtrend accelerated after price lost the Value Area High, a level that previously marked fair value within the broader trading range. Since that breakdown, each attempt to recover has been met with selling pressure, resulting in a series of lower highs, a classic sign of bearish continuation.

One of the most telling developments has been the bearish retest of the Point of Control (POC). After initially breaking below this key volume level, HBAR attempted to reclaim it but failed, confirming the POC as resistance. In market auction theory, this behavior signals acceptance at lower prices rather than a temporary deviation. Once an acceptance below value is established, markets often seek out lower liquidity pools.

The loss of the Value Area Low (VAL) further reinforces the bearish thesis. Trading below the VAL indicates that price has exited the prior area of balance and entered a lower-value regime. This transition often leads to directional movement as the market searches for new demand.

In HBAR’s case, that search is now occurring near the $0.11 high-time-frame support, a level that has historically acted as a defensive zone for buyers.

From a market-structure perspective, the risk is amplified by the lack of significant support below $0.11. If this level fails on a closing basis, HBAR could quickly accelerate toward the previous swing low, where resting liquidity is likely concentrated. Such moves often unfold rapidly, as stop-losses are triggered and late sellers are forced to exit positions, the defining characteristics of capitulation.

Momentum indicators also support caution. Sustained bearish momentum typically persists until a clear structural shift occurs, such as a break in the sequence of lower highs or a reclaim of key resistance levels. Neither of these conditions has been met. Instead, each relief rally has been corrective and short-lived, reinforcing seller dominance.

Capitulation does not imply the end of a downtrend but rather an acceleration phase in which price moves aggressively to clear remaining liquidity. While capitulation can eventually set the stage for longer-term stabilization, it is often painful in the short term and occurs only after critical supports are decisively broken.

What to expect in the coming price action

As long as HBAR trades below the Point of Control and fails to reclaim value, downside risk remains elevated. A clean break below $0.11 could trigger a capitulation-style move toward the prior swing low. Any bullish invalidation would require strong buying pressure, a reclaim of the Value Area Low, and a break in the bearish market structure, signals that have yet to emerge.

Market Opportunity
Hedera Logo
Hedera Price(HBAR)
$0.0964
$0.0964$0.0964
-0.44%
USD
Hedera (HBAR) Live Price Chart
Disclaimer: The articles reposted on this site are sourced from public platforms and are provided for informational purposes only. They do not necessarily reflect the views of MEXC. All rights remain with the original authors. If you believe any content infringes on third-party rights, please contact crypto.news@mexc.com for removal. MEXC makes no guarantees regarding the accuracy, completeness, or timeliness of the content and is not responsible for any actions taken based on the information provided. The content does not constitute financial, legal, or other professional advice, nor should it be considered a recommendation or endorsement by MEXC.

You May Also Like

Wormhole breekt door $0,10 en stijgt meer dan 30%

Wormhole breekt door $0,10 en stijgt meer dan 30%

Wormhole (W) knalt vandaag door een belangrijk technisch niveau en laat een forse stijging zien. Na maanden van handel onder de grens van $0,10 is de coin er nu overtuigend doorheen gebroken. Met een koers van $0,116 en een handels volume van $404,49 miljoen in de afgelopen 24 uur, noteert... Het bericht Wormhole breekt door $0,10 en stijgt meer dan 30% verscheen het eerst op Blockchain Stories.
Share
Coinstats2025/09/18 20:33
3 Paradoxes of Altcoin Season in September

3 Paradoxes of Altcoin Season in September

The post 3 Paradoxes of Altcoin Season in September appeared on BitcoinEthereumNews.com. Analyses and data indicate that the crypto market is experiencing its most active altcoin season since early 2025, with many altcoins outperforming Bitcoin. However, behind this excitement lies a paradox. Most retail investors remain uneasy as their portfolios show little to no profit. This article outlines the main reasons behind this situation. Altcoin Market Cap Rises but Dominance Shrinks Sponsored TradingView data shows that the TOTAL3 market cap (excluding BTC and ETH) reached a new high of over $1.1 trillion in September. Yet the share of OTHERS (excluding the top 10) has declined since 2022, now standing at just 8%. OTHERS Dominance And TOTAL3 Capitalization. Source: TradingView. In past cycles, such as 2017 and 2021, TOTAL3 and OTHERS.D rose together. That trend reflected capital flowing not only into large-cap altcoins but also into mid-cap and low-cap ones. The current divergence shows that capital is concentrated in stablecoins and a handful of top-10 altcoins such as SOL, XRP, BNB, DOG, HYPE, and LINK. Smaller altcoins receive far less liquidity, making it hard for their prices to return to levels where investors previously bought. This creates a situation where only a few win while most face losses. Retail investors also tend to diversify across many coins instead of adding size to top altcoins. That explains why many portfolios remain stagnant despite a broader market rally. Sponsored “Position sizing is everything. Many people hold 25–30 tokens at once. A 100x on a token that makes up only 1% of your portfolio won’t meaningfully change your life. It’s better to make a few high-conviction bets than to overdiversify,” analyst The DeFi Investor said. Altcoin Index Surges but Investor Sentiment Remains Cautious The Altcoin Season Index from Blockchain Center now stands at 80 points. This indicates that over 80% of the top 50 altcoins outperformed…
Share
BitcoinEthereumNews2025/09/18 01:43
WLD Price Prediction: Worldcoin Eyes $0.42 Recovery Amid Technical Consolidation

WLD Price Prediction: Worldcoin Eyes $0.42 Recovery Amid Technical Consolidation

Worldcoin (WLD) trades at $0.39 with neutral RSI at 46, targeting $0.42 resistance. Technical indicators suggest consolidation before potential breakout. (Read
Share
BlockChain News2026/03/07 20:35