

Bitcoin Price Weakens Further, Additional Losses Now on the Table
Bitcoin price failed to continue higher and dipped below $88,500. BTC is now declining and might struggle to stay above $86,800.
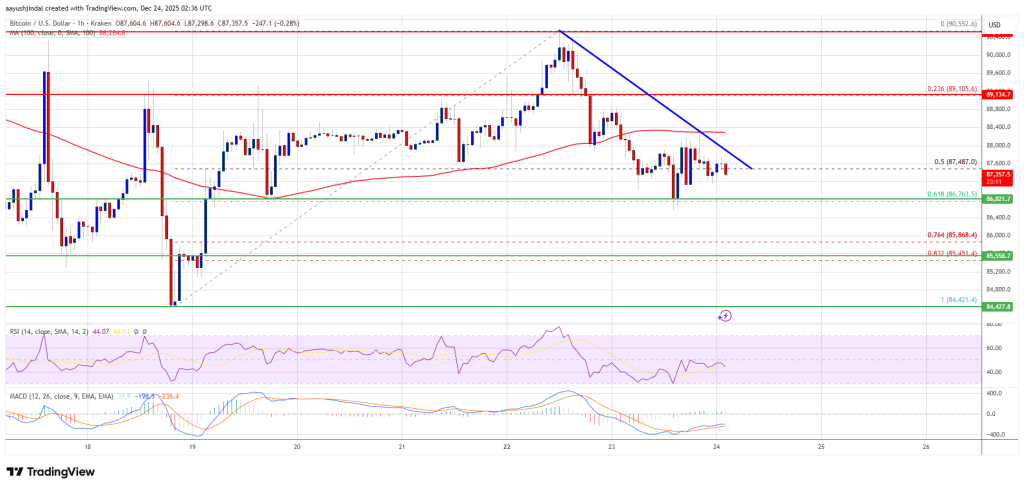
- Bitcoin started a fresh decline from the $90,500 zone.
- The price is trading below $88,000 and the 100 hourly Simple moving average.
- There is a bearish trend line forming with resistance at $87,650 on the hourly chart of the BTC/USD pair (data feed from Kraken).
- The pair might continue to move down if it trades below the $86,800 zone.
Bitcoin Price Corrects Gains
Bitcoin price failed to stay in a positive zone and started a fresh decline below $90,000. BTC dipped below $89,500 and $88,500 to move into a bearish zone.
The bears were able to push the price below the 50% Fib retracement level of the upward move from the $84,420 swing low to the $90,552 high. Besides, there is a bearish trend line forming with resistance at $87,650 on the hourly chart of the BTC/USD pair.
Bitcoin is now trading below $88,000 and the 100 hourly Simple moving average. If the price remains stable above $87,000, it could attempt a fresh recovery wave. Immediate resistance is near the $87,650 level and the trend line.
The first key resistance is near the $88,500 level. The next resistance could be $89,100. A close above the $89,100 resistance might send the price further higher. In the stated case, the price could rise and test the $90,000 resistance. Any more gains might send the price toward the $90,500 level. The next barrier for the bulls could be $91,500 and $92,000.
More Losses In BTC?
If Bitcoin fails to rise above the $88,500 resistance zone, it could start another decline. Immediate support is near the $87,000 level. The first major support is near the $86,750 level and the 61.8% Fib retracement level of the upward move from the $84,420 swing low to the $90,552 high.
The next support is now near the $86,000 zone. Any more losses might send the price toward the $85,450 support in the near term. The main support sits at $84,500, below which BTC might accelerate lower in the near term.
Technical indicators:
Hourly MACD – The MACD is now gaining pace in the bearish zone.
Hourly RSI (Relative Strength Index) – The RSI for BTC/USD is now below the 50 level.
Major Support Levels – $86,750, followed by $86,000.
Major Resistance Levels – $87,650 and $88,500.


You May Also Like

Samsung Electronics Targets Record Q1 Profit as Memory Chip Supercycle Hits Full Stride

One Of Frank Sinatra’s Most Famous Albums Is Back In The Spotlight


