

XRP at a Critical Juncture as On-Chain Data and Charts Tell Different Stories
XRP has declined 11.4% so far in December, putting the asset on track to close the year in the red and ending its two-year streak of annual gains. The downturn reflects weakening market momentum, with on-chain data indicating that selling pressure is intensifying as inflows into Binance rise.
Despite this bearish backdrop, some analysts remain cautiously optimistic. They argue that XRP could be setting up for a recovery similar to its 2017 cycle.
Rising Binance Inflows Signal Growing Sell-Side Pressure on XRP
XRP has struggled alongside the broader market this quarter, posting consecutive monthly losses. Data from CryptoRank shows the token fell 11.9% in October, followed by a sharper 13.8% decline in November.
The weakness has continued into December, with XRP down 11.4% so far this month. Amid this downturn, analyst Darkfost highlighted signs of growing sell-side pressure.
On-chain data reveals a sharp increase in XRP inflows to Binance beginning December 15, with daily deposits ranging between 35 million XRP and peaking at 116 million XRP on December 19. This surge followed a period of relatively stable and moderate exchange inflows.
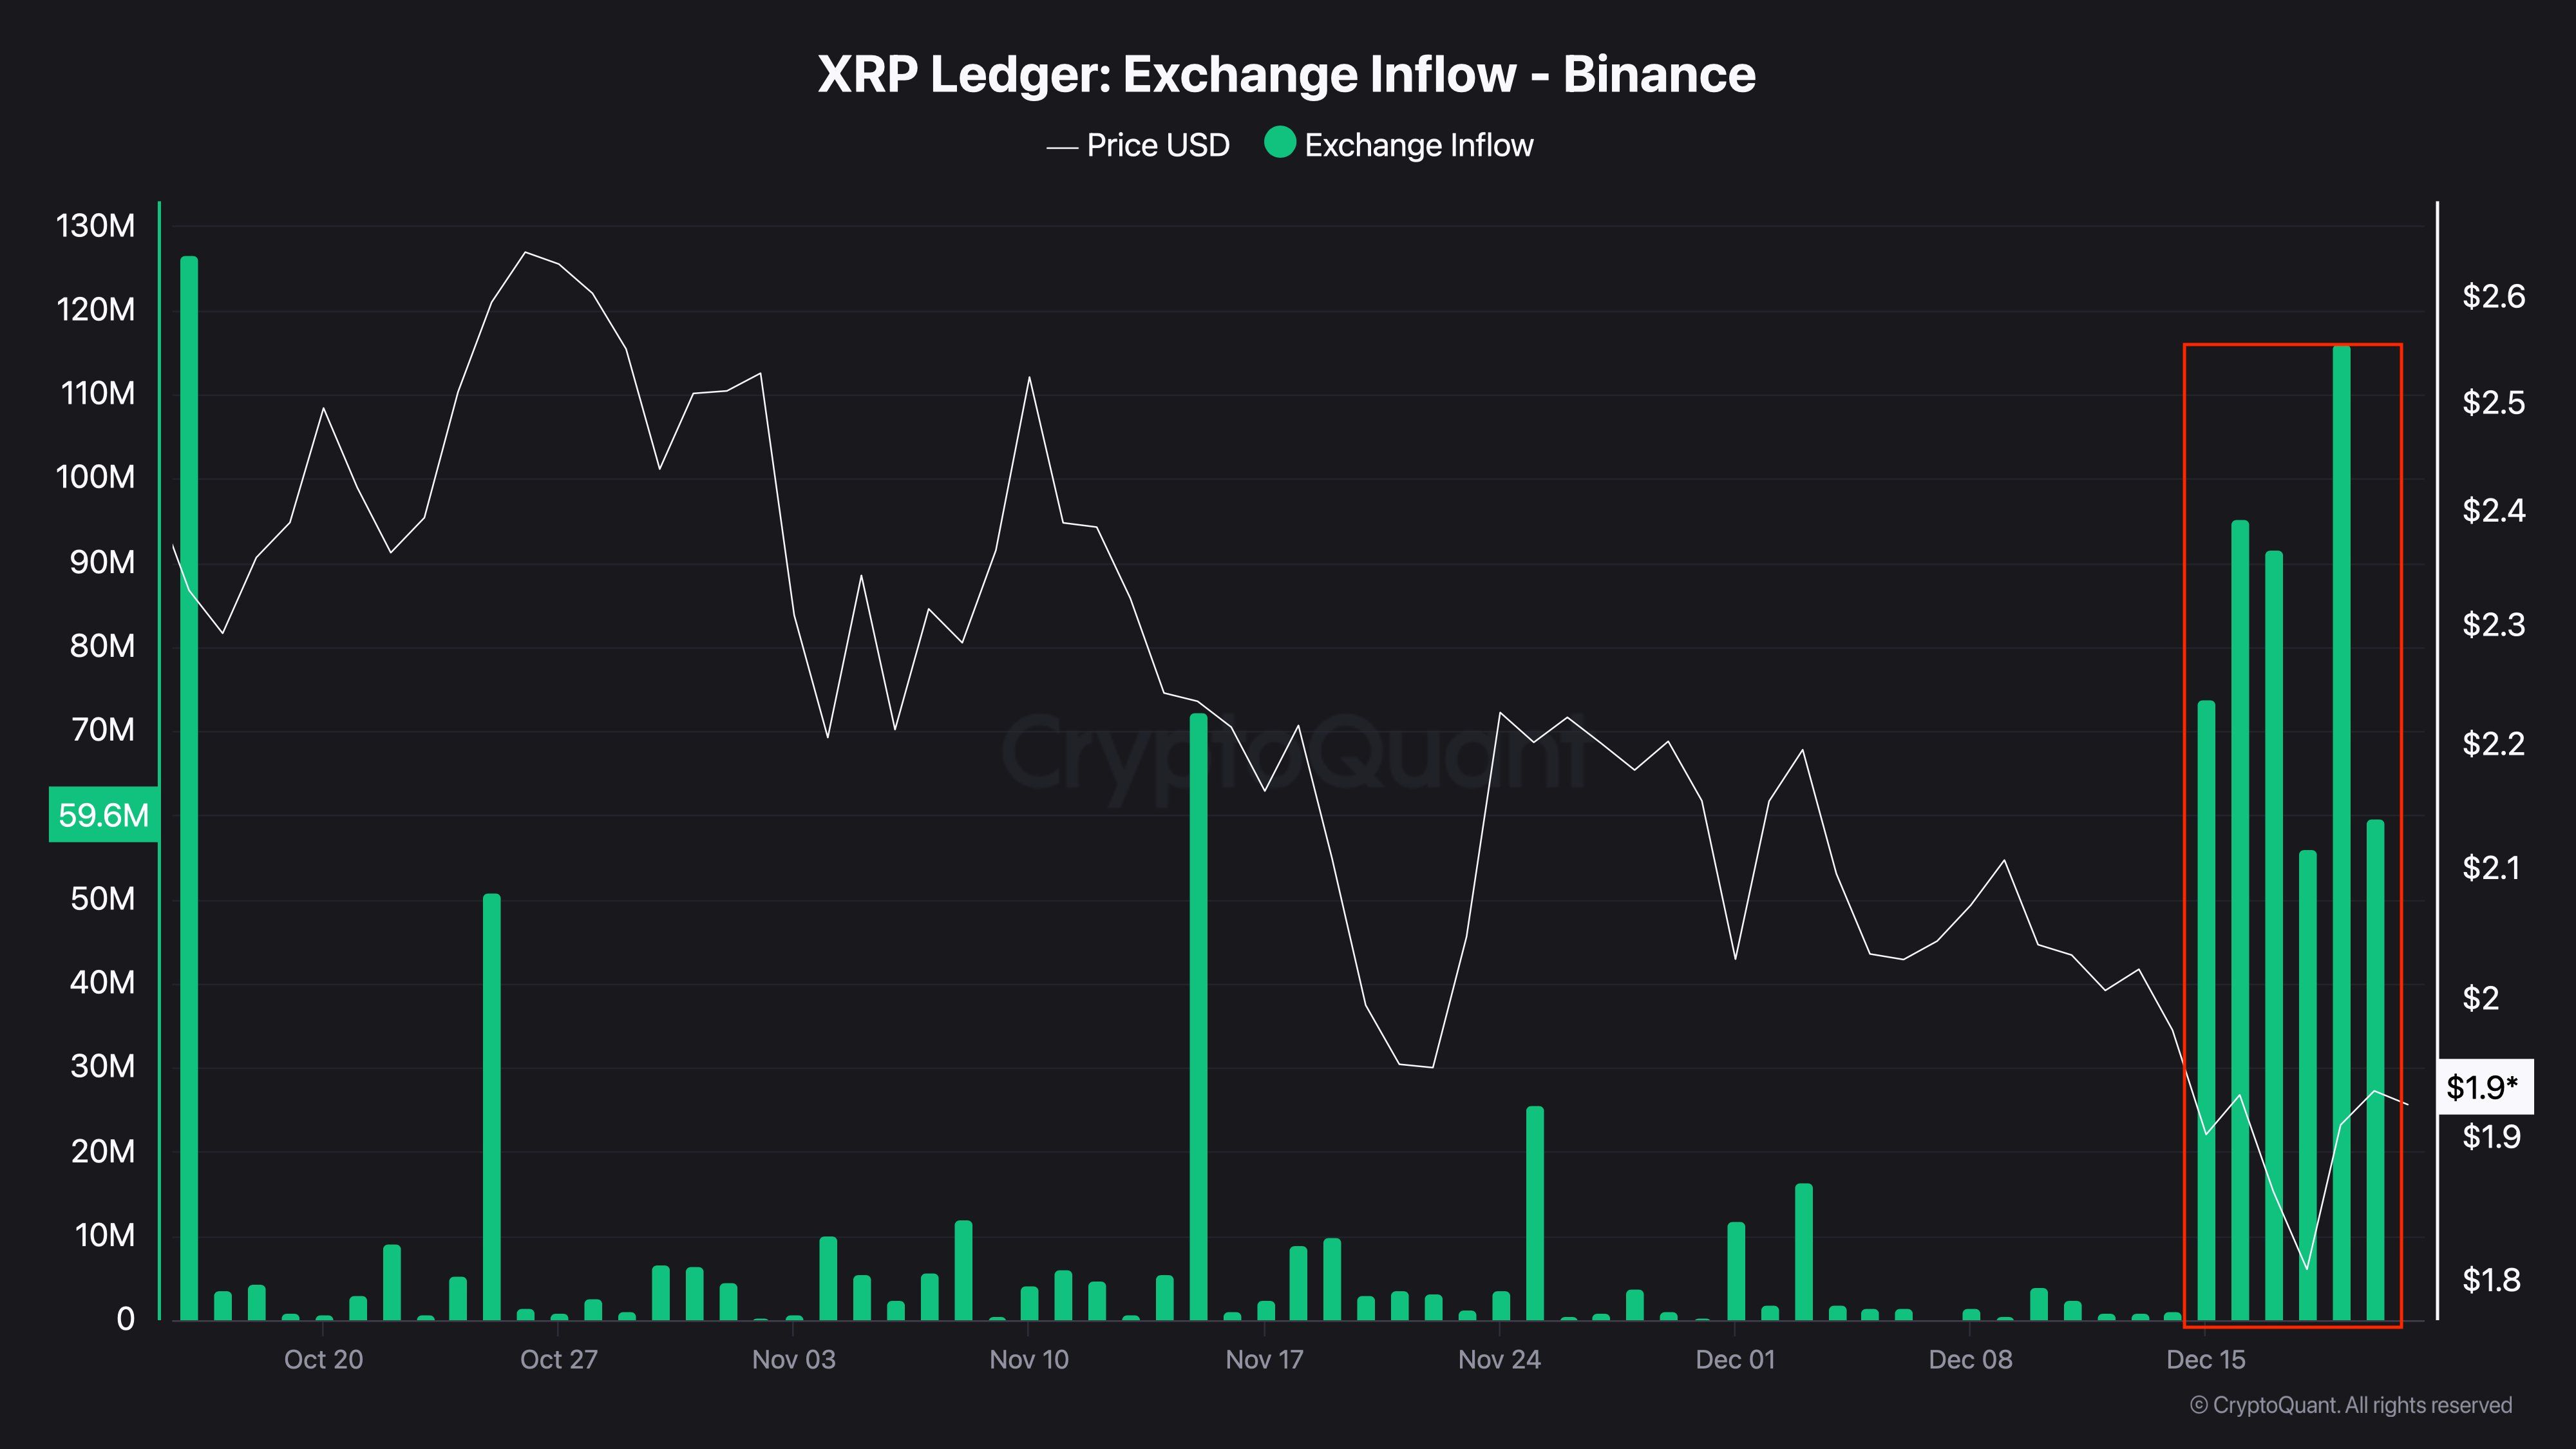 XRP Inflows to Binance. Source: Darkfost
According to the analyst, this shift also signals a change in investor behavior.
A recent BeInCrypto analysis also found that wallets holding XRP for 2 to 3 years declined sharply from 14.26% of supply on November 26 to about 5.66% on December 26.
Lastly, Darkfost added that as long as exchange inflows remain elevated or continue to increase, XRP could face challenges to enter a genuine accumulation phase. The analyst warned that sustained sell-side pressure could prolong the current correction and even potentially push prices lower.
Will XRP Stage a 2017-Style Recovery?
Despite this, several market watchers remain optimistic about the coin’s outlook. One analyst pointed out that a potential Adam and Eve pattern may be forming on XRP’s 1-hour chart.
The Adam and Eve pattern is a technical reversal formation that signals a possible shift from a downtrend to an uptrend. It consists of two distinct lows: the first, known as the “Adam” bottom, is sharp and V-shaped, reflecting panic-driven selling.
The second, the “Eve” bottom, is more rounded, indicating stabilizing price action and reduced selling pressure. A confirmed breakout above the pattern’s neckline is typically viewed as a bullish signal, suggesting that buyers are regaining control.
Moreover, some analysts argue that XRP’s current market structure closely mirrors its price behavior in 2017.
However, it’s worth noting that such comparisons rely heavily on historical symmetry, which may not always repeat under different market conditions.
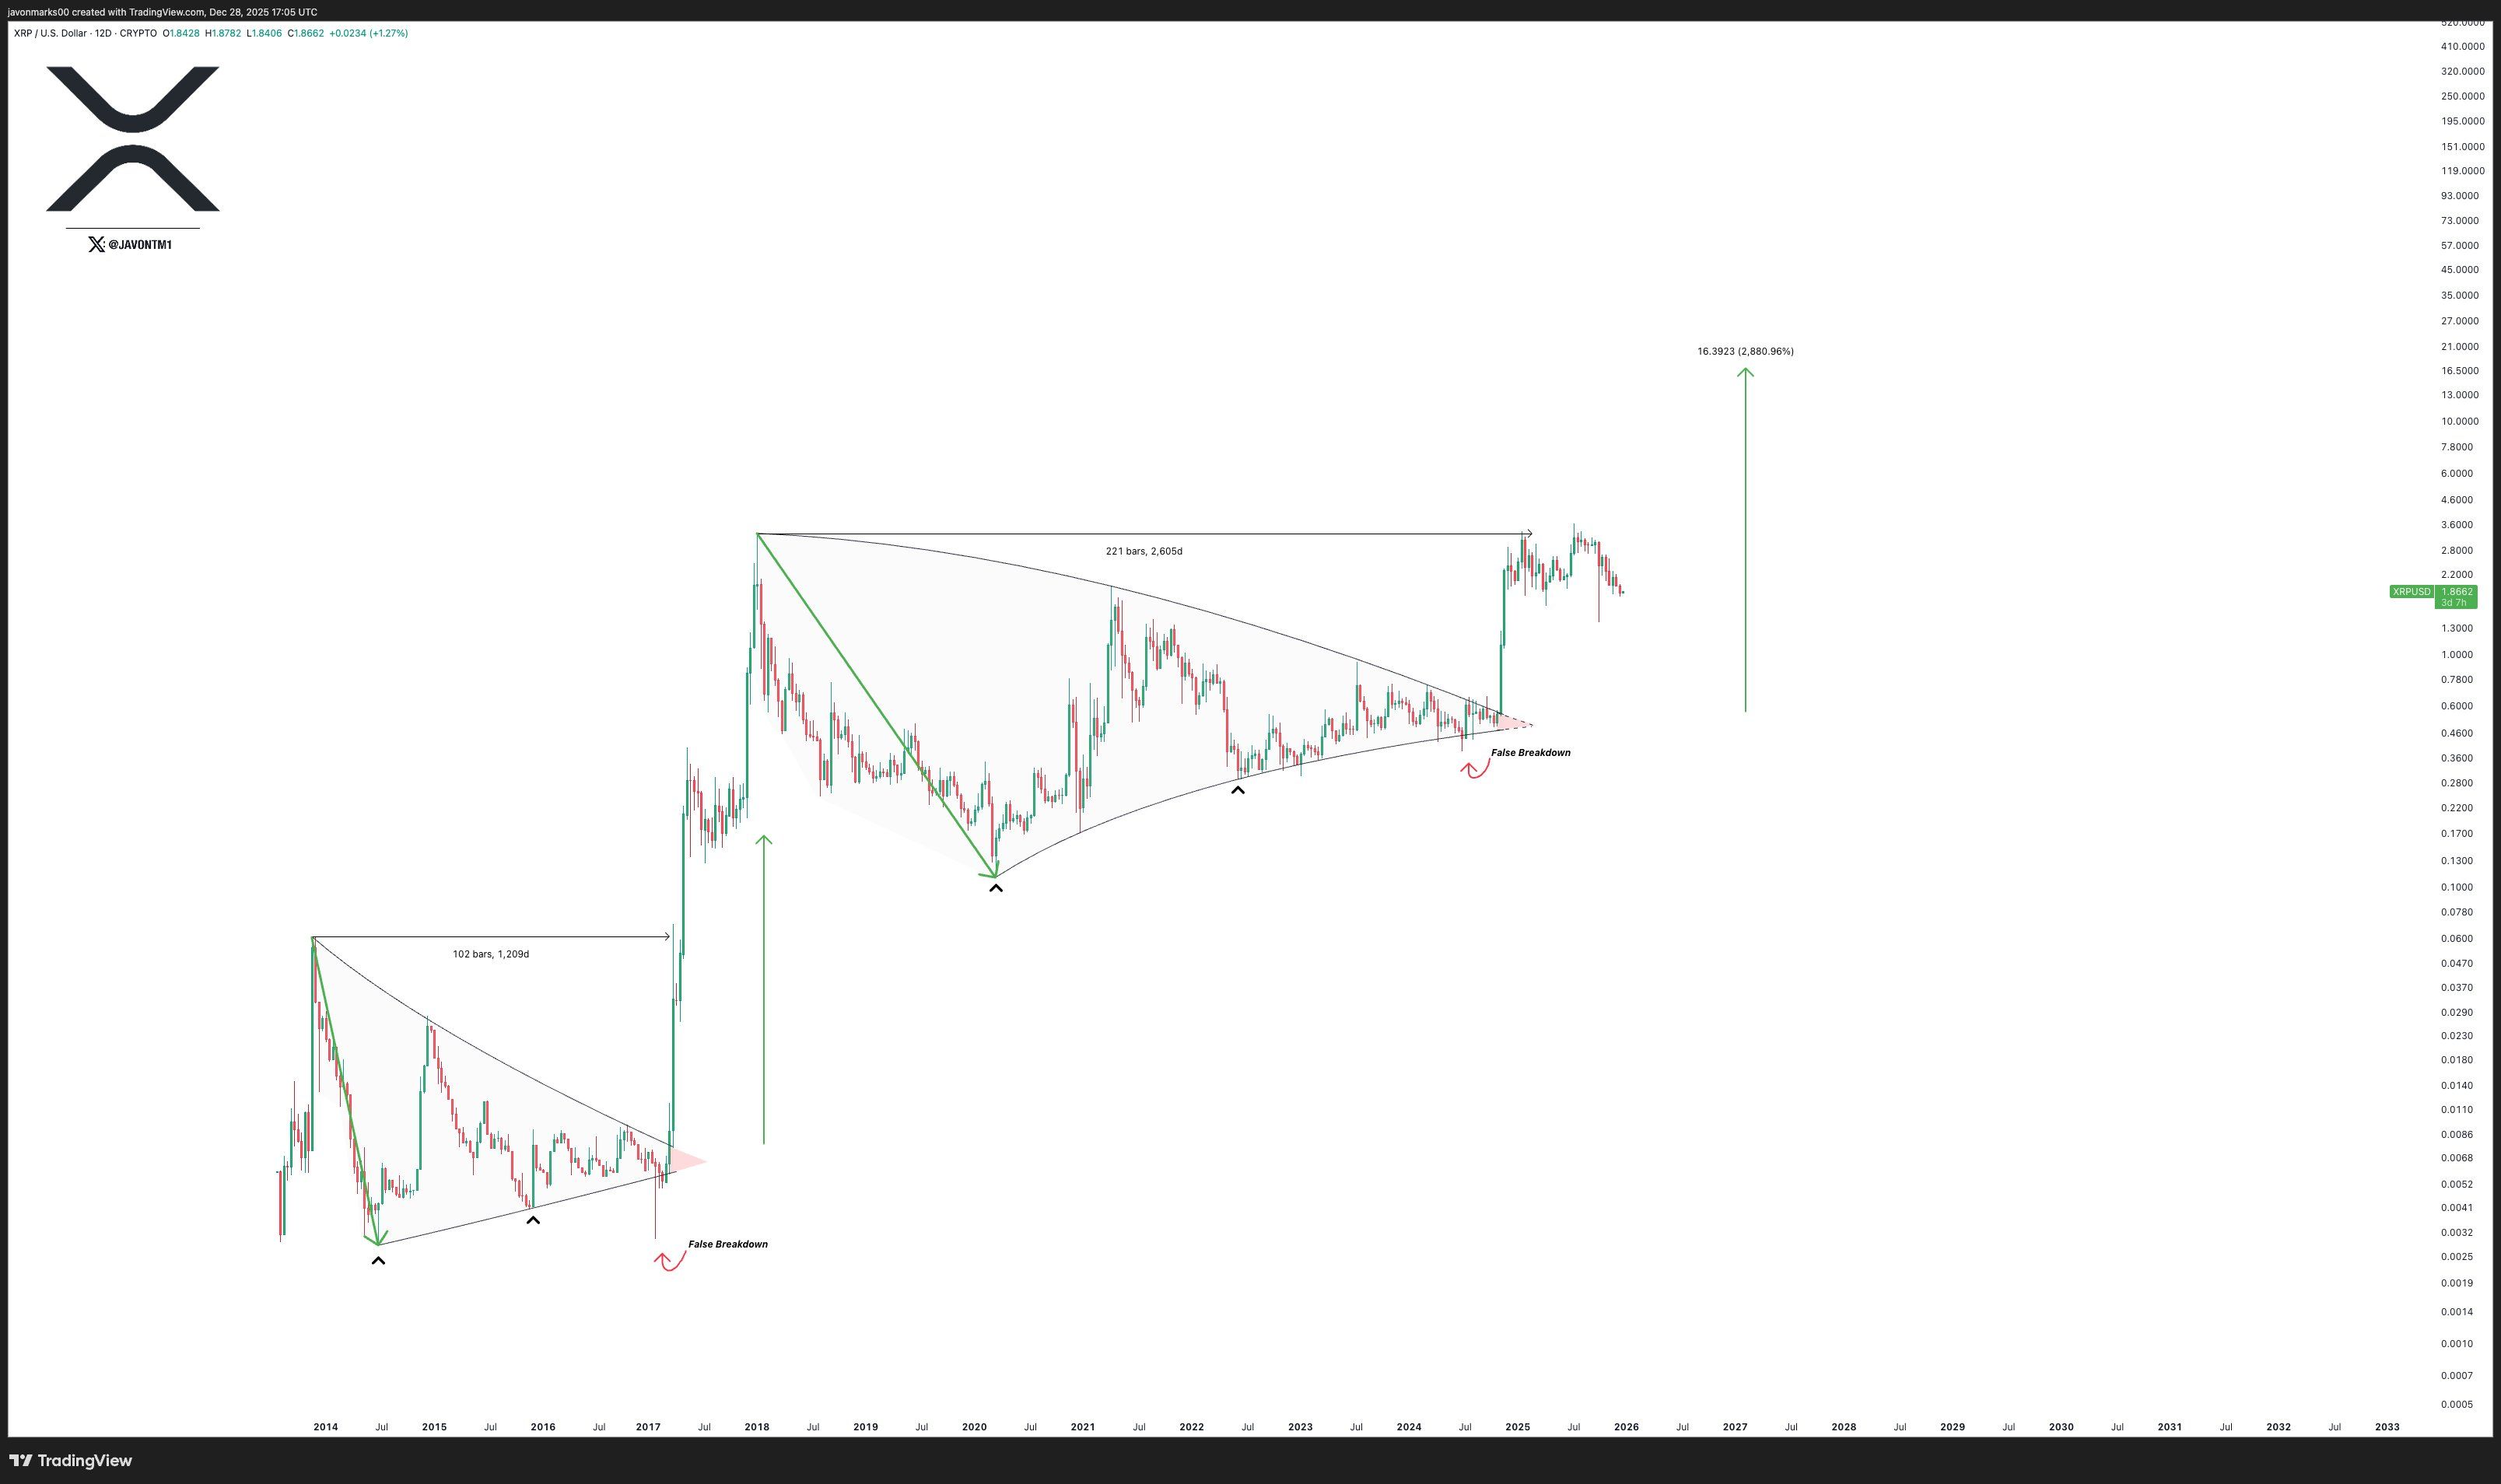 XRP Price in 2017 Compared to 2025. Source: X/JavonTM1
As 2025 draws to a close, XRP remains at a crossroads. Rising exchange inflows indicate sell-side pressure, while technical indicators and historical comparisons suggest a potential recovery. Whether bullish signals can outweigh the weakening on-chain fundamentals will likely become clearer in the coming weeks.


You May Also Like

Critical USDT0 Response to Drift Hack Exposes Stark Contrast in Stablecoin Security Protocols
Ripple (XRP) ETFs Went From Bad to Worse: First Red Month and No Inflow Days


