Despite the ongoing general market downturn, where over 50% of non-fungible token collections have lost more than 60% of their floor price value, some NFT [...]Despite the ongoing general market downturn, where over 50% of non-fungible token collections have lost more than 60% of their floor price value, some NFT [...]

Ethereum Price Breaks $3K In Relief Rally Despite BOJ Signaling Further Rate Cuts

The Ethereum price surged over 2% in the past 24 hours to trade at $3,039 as of 03:03 a.m. EST, with trading volume soaring 132% to $18.3 billion.

ETH broke the $3,000 level in a relief rally, even after the Bank of Japan’s (BoJ) summary of opinions from the December policy meeting reinforced expectations of continued tightening in 2026.

The BoJ raised its policy rate to 0.75% from 0.50% at its December policy meeting, the highest in 30 years. According to the summary of opinions released early Monday showed that some board members see the need for further rate increases in the near future.

Some board members believe that current rates are still lower than what they should be when adjusted for inflation.

Economists are projecting a rate between 1.25% and 1.5% in 2027.

The crypto market has dropped significantly following changes in BOJ’s policies in the past.

Can the projections affect the price of Ethereum?

Ethereum Price Indicators Support A Bullish Reversal After A Consolidation

According to the ETH/USD chart analysis on the daily chart, the ETH price is still trading within a consolidation zone between the $3,400 resistance and the $2,650 support, with investors picking up some cautious trend.

As shown by the trend-based Fibonacci Retracement levels, the Ethereum price rallied mid-year to push ETH to an all-time high (ATH) of around $4,940 in September. After the surge, the bulls could not sustain the uptrend, after which the price of ETH dropped within a falling channel pattern, breaking key support Fib levels.

However, after hitting the support are around $2,650, ETH has been moving in a sideways pattern, capped by the $3,400 resistance area.

The continued downtrend was further supported by Simple Moving Averages (SMAs) forming a death cross around $3,545. The price of Ethereum has since traded below both the 50-day and 200-day SMAs.

Short-term projection shows the Ethereum price is poised for a surge, as it pushes towards the 50-day SMA ($3,041).

Meanwhile, major indicators support the bullish case, with the Relative Strength Index (RSI) pushing above the 50-midline level, currently at 51.60.

The Moving Average Convergence Divergence (MACD) also supports this outlook, with the blue MACD line crossing above the orange signal line. Green bars on the histogram are also starting to form above the neutral line, a signal of positive momentum.

Ethereum Price Chart Analysis Source: GeckoTerminal
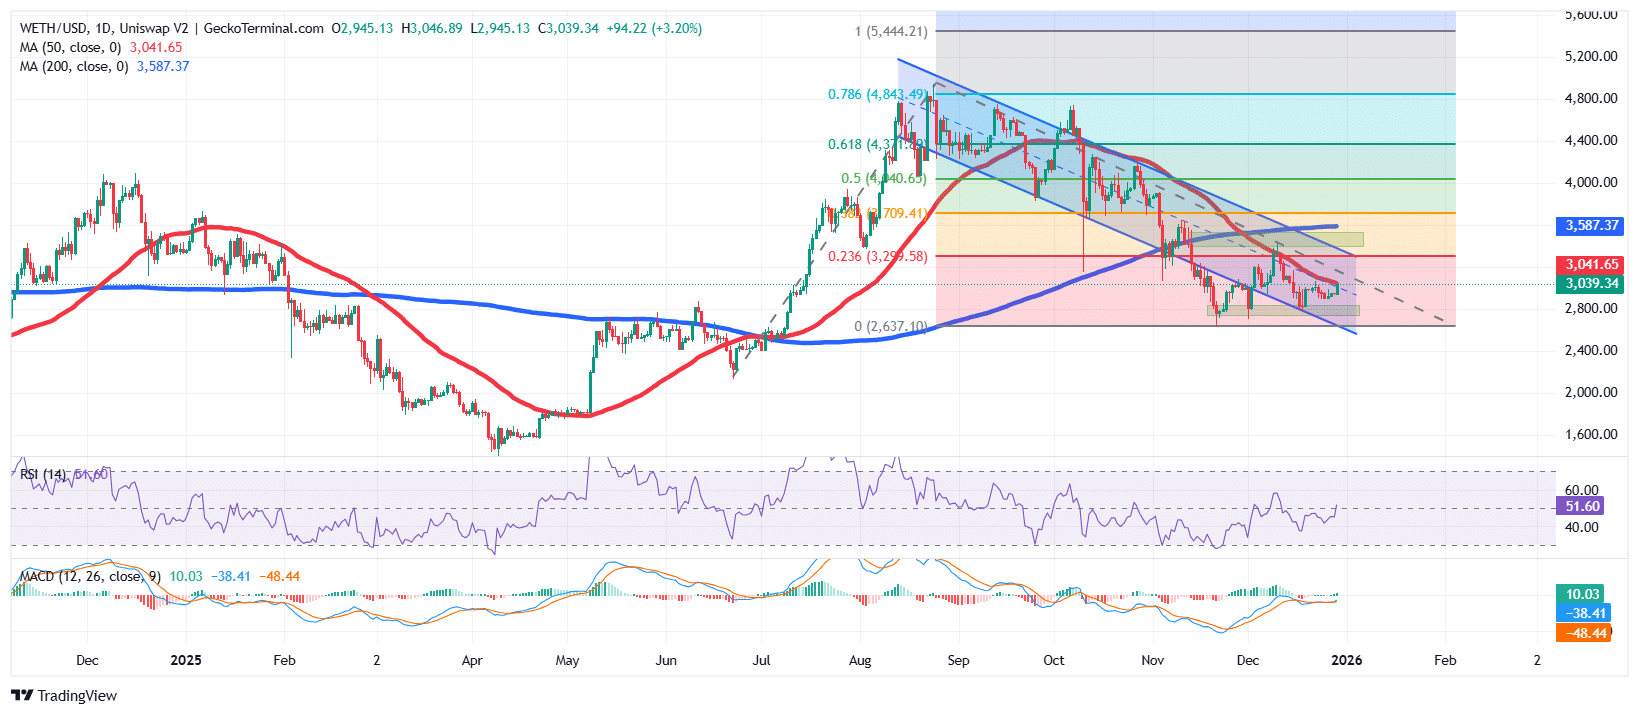
ETH/USD Chart Analysis Source: GeckoTerminal

ETH Price Prediction

The latest candle on the daily timeframe shows that the ETH price is currently gearing up for a surge, as it closes in on the 50-day SMA, acting as the immediate resistance area.

If the ETH bulls maintain the rally above the $3,000 area and close the 50-day SMA, the next key resistance area and target is within the 0.236 Fib area at $3,299. A sustained rally could then push the price of Ethereum to target the previous supply zone at $3,709.

Conversely, if the price of ETH continues to trade within a falling channel to break below the $2,800 support, the next cushion against downward pressure is at the $2,400 support area, below the current support.

This could be the case if spot ETH exchange-traded funds (ETFs) continue losing. According to data from Ali Martinez on X, over $32 million worth of Ethereum was sold by ETFs last week.

Market Opportunity
TokenFi Logo
TokenFi Price(TOKEN)
$0.006623
$0.006623$0.006623
-13.57%
USD
TokenFi (TOKEN) Live Price Chart
Disclaimer: The articles reposted on this site are sourced from public platforms and are provided for informational purposes only. They do not necessarily reflect the views of MEXC. All rights remain with the original authors. If you believe any content infringes on third-party rights, please contact service@support.mexc.com for removal. MEXC makes no guarantees regarding the accuracy, completeness, or timeliness of the content and is not responsible for any actions taken based on the information provided. The content does not constitute financial, legal, or other professional advice, nor should it be considered a recommendation or endorsement by MEXC.

You May Also Like

Why the Visa Card Narrative Makes it the Best Crypto to Buy

Why the Visa Card Narrative Makes it the Best Crypto to Buy

The post Why the Visa Card Narrative Makes it the Best Crypto to Buy appeared on BitcoinEthereumNews.com. As investors look beyond hype narratives and toward 2026
Share
BitcoinEthereumNews2025/12/29 23:56
What Are Small DC Electric Motors? A Complete Guide to Types and Uses

What Are Small DC Electric Motors? A Complete Guide to Types and Uses

Small DC electric motors drive innovation in modern technology, powering everything from smartphones to robotic arms. These compact powerhouses offer safe low-voltage
Share
Techbullion2025/12/30 00:04
BlackRock boosts AI and US equity exposure in $185 billion models

BlackRock boosts AI and US equity exposure in $185 billion models

The post BlackRock boosts AI and US equity exposure in $185 billion models appeared on BitcoinEthereumNews.com. BlackRock is steering $185 billion worth of model portfolios deeper into US stocks and artificial intelligence. The decision came this week as the asset manager adjusted its entire model suite, increasing its equity allocation and dumping exposure to international developed markets. The firm now sits 2% overweight on stocks, after money moved between several of its biggest exchange-traded funds. This wasn’t a slow shuffle. Billions flowed across multiple ETFs on Tuesday as BlackRock executed the realignment. The iShares S&P 100 ETF (OEF) alone brought in $3.4 billion, the largest single-day haul in its history. The iShares Core S&P 500 ETF (IVV) collected $2.3 billion, while the iShares US Equity Factor Rotation Active ETF (DYNF) added nearly $2 billion. The rebalancing triggered swift inflows and outflows that realigned investor exposure on the back of performance data and macroeconomic outlooks. BlackRock raises equities on strong US earnings The model updates come as BlackRock backs the rally in American stocks, fueled by strong earnings and optimism around rate cuts. In an investment letter obtained by Bloomberg, the firm said US companies have delivered 11% earnings growth since the third quarter of 2024. Meanwhile, earnings across other developed markets barely touched 2%. That gap helped push the decision to drop international holdings in favor of American ones. Michael Gates, lead portfolio manager for BlackRock’s Target Allocation ETF model portfolio suite, said the US market is the only one showing consistency in sales growth, profit delivery, and revisions in analyst forecasts. “The US equity market continues to stand alone in terms of earnings delivery, sales growth and sustainable trends in analyst estimates and revisions,” Michael wrote. He added that non-US developed markets lagged far behind, especially when it came to sales. This week’s changes reflect that position. The move was made ahead of the Federal…
Share
BitcoinEthereumNews2025/09/18 01:44