Humanity Protocol (H) witnessed a strong rebound after forming a base near its December lows, but the upside momentum appears to be slowing as the price strugglesHumanity Protocol (H) witnessed a strong rebound after forming a base near its December lows, but the upside momentum appears to be slowing as the price struggles

Humanity Protocol Price Analysis: H Eyes Key $0.17–$0.18 Resistance After Recent Rally

2025/12/30 23:06
3 min read
For feedback or concerns regarding this content, please contact us at crypto.news@mexc.com
  • Humanity Protocol is trading near the $0.166 range after a short recovery phase with immediate support seen around $0.150
  • A move above $0.18–$0.20 is needed to sustain bullish momentum.

Humanity Protocol (H) witnessed a strong rebound after forming a base near its December lows, but the upside momentum appears to be slowing as the price struggles to move past a key resistance zone. After posting steady gains over the past few sessions, H coin has now entered a consolidation phase just below the $0.17 level.

According to the daily chart, Humanity Protocol staged a notable recovery after slipping below the $0.04 range earlier this month. Then, buyers gradually stepped in, pushing the price higher and helping H coin to reclaim the $0.16 level. The rally extended toward the $0.18 area, where selling pressure emerged once again. 

Earlier today, H coin briefly tested highs near $0.1801, but failed to hold those levels and pulled back slightly. At the time of writing, Humanity Protocol is trading around $0.1670, marking a 0.14% gain on the day.
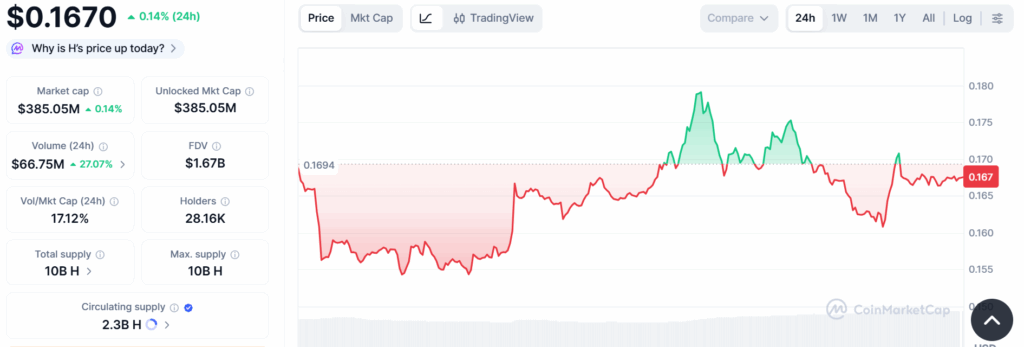
(Source: CMC)

In the last 7 days, H coin has seen stronger performance with rallies lifting price from lower ranges to the current level. However, it remains well below its all-time high near $0.38 recorded in late October 2025, indicating room for recovery but also resistance ahead. 

Short-Term Price Action Highlights:

  • Current Trading Range: $0.148-$0.167 (24h trading band)
  • Recent Monthly Moves: +60%+ gains from recent swing lows in the past week.
  • All-Time High: $0.3887 (still significantly above 57% from current price).

Support remains firm near $0.14 with psychological support around $0.13, while a breakout above $0.17–$0.18 could bring the way to retest previous cycle highs. Immediate resistance is clearly visible near $0.1685–$0.17 where sellers have stepped in previously.

What Technical Indicators Are Suggesting

Technical indicators are showing mixed signals but slightly positive signals. The RSI is currently at 60.56, which indicates moderate bullish momentum while remaining below overbought territory. This suggests buyers are active but not over dominant.

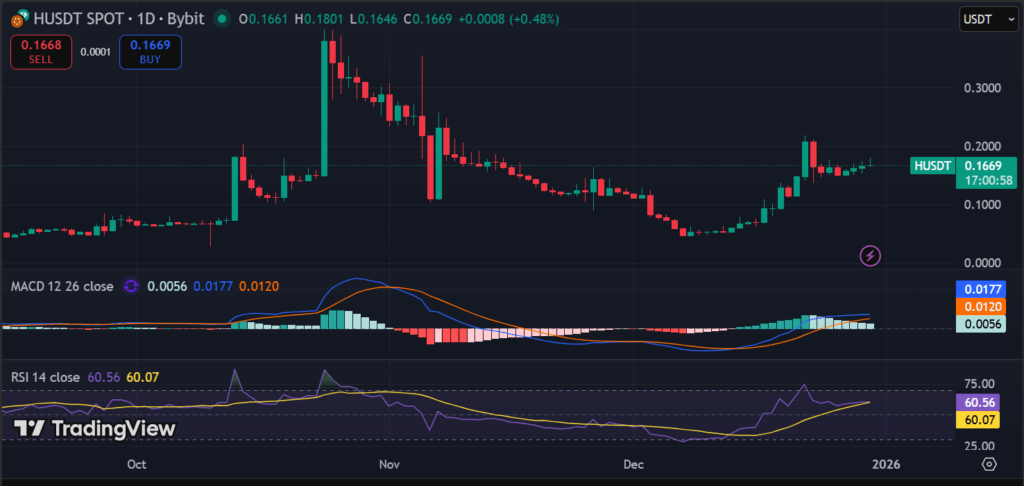
(Source: TradingView)

Meanwhile, the MACD indicator shows the MACD line at 0.0177, still above the signal line at 0.0120 with a positive histogram reading of 0.0056. This reflects improving momentum, although the slope remains relatively flat, hinting at slowing upside strength rather than a strong breakout. Zooming in, ADX at 31 that suggests strengthening trend if price maintains current direction.

Overall, the indicators point toward consolidation with neither bulls nor bears fully in control at this stage.

Key Levels to Watch for Humanity Protocol

Support Levels

  • $0.14: Near-term pivot and first line of support.
  • $0.13: Psychological and swing low support.
  • $0.11: Major support if price weakens sharply.

Resistance Levels

  • $0.17–$0.175: Initial hurdle where sellers have emerged.
  • $0.18: Key breakout zone for sustainable upside.
  • $0.20+: Longer-term target if momentum builds.

Market Sentiment & Outlook

Humanity Protocol is currently in a consolidation phase following its recent rebound. While trend tools still lean slightly bullish, price action suggests hesitation near resistance. A clear breakout above $0.18 could return bullish sentiment, while failure to hold above $0.15 may shift the short-term outlook back to neutral or bearish.

Highlighted Crypto News:

Altcoin ETFs Shine as XRP Hits 29-Day Inflow Streak and SOL Draw Capital While BTC and ETH Stall

Disclaimer: The articles reposted on this site are sourced from public platforms and are provided for informational purposes only. They do not necessarily reflect the views of MEXC. All rights remain with the original authors. If you believe any content infringes on third-party rights, please contact crypto.news@mexc.com for removal. MEXC makes no guarantees regarding the accuracy, completeness, or timeliness of the content and is not responsible for any actions taken based on the information provided. The content does not constitute financial, legal, or other professional advice, nor should it be considered a recommendation or endorsement by MEXC.

You May Also Like

Litecoin Fluctuates Below The $116 Threshold

Litecoin Fluctuates Below The $116 Threshold

The post Litecoin Fluctuates Below The $116 Threshold appeared on BitcoinEthereumNews.com. Sep 17, 2025 at 23:05 // Price Litecoin price analysis by Coinidol.com: LTC price has slipped below the moving average lines after hitting resistance at $120. Litecoin price long-term prediction: bearish The 21-day SMA support helped to alleviate the selling pressure. In other words, the price of the cryptocurrency is above the 21-day SMA support but below the 50-day SMA barrier. This suggests that Litecoin will be trapped in a narrow range for a few days. If the 21-day SMA support or the 50-day SMA barrier is overreached, the cryptocurrency will trend upwards. For example, if the LTC price breaks through the 50-day SMA barrier, it will rise to a high of $124. Litecoin will fall to its current support level of $106 if the 21-day SMA support is broken. Technical Indicators  Resistance Levels: $100, $120, $140 Support Levels: $60, $40, $20 LTC price indicators analysis Litecoin’s price is squeezed between the moving average lines. It is unclear in which direction Litecoin will move. The moving average lines are horizontal in both charts. However, the price bars are limited to the distance between the moving averages. The price bars on the 4-hour chart are below the moving average lines. LTC/USD price chart – September 17, 2025 What is the next move for LTC? On the 4-hour chart, Litecoin is currently trading in a bearish trend zone. The altcoin is trading above the $112 support and below the moving average lines, which represent resistance at $116. The upward movement is hindered by the moving average lines, which are causing the price to oscillate within a limited range. Meanwhile, the signal for the cryptocurrency is bearish, with price bars below the moving average…
Share
BitcoinEthereumNews2025/09/18 08:15
CME to launch Solana and XRP futures options on October 13, 2025

CME to launch Solana and XRP futures options on October 13, 2025

The post CME to launch Solana and XRP futures options on October 13, 2025 appeared on BitcoinEthereumNews.com. Key Takeaways CME Group will launch futures options for Solana (SOL) and XRP. The launch date is set for October 13, 2025. CME Group will launch futures options for Solana and XRP on October 13, 2025. The Chicago-based derivatives exchange will add the new crypto derivatives products to its existing digital asset offerings. The launch will provide institutional and retail traders with additional tools to hedge positions and speculate on price movements for both digital assets. The futures options will be based on CME’s existing Solana and XRP futures contracts. Trading will be conducted through CME Globex, the exchange’s electronic trading platform. Source: https://cryptobriefing.com/cme-solana-xrp-futures-options-launch-2025/
Share
BitcoinEthereumNews2025/09/18 01:07
US-Israel airstrikes trigger 700% surge in Iran crypto outflows

US-Israel airstrikes trigger 700% surge in Iran crypto outflows

The post US-Israel airstrikes trigger 700% surge in Iran crypto outflows appeared on BitcoinEthereumNews.com. Homepage > News > Business > US-Israel airstrikes
Share
BitcoinEthereumNews2026/03/05 16:01