Hyperliquid price is under pressure as traders brace for a large token unlock scheduled for Jan. 6. HYPE was trading at $26.45 at press time, up 4% in the past Hyperliquid price is under pressure as traders brace for a large token unlock scheduled for Jan. 6. HYPE was trading at $26.45 at press time, up 4% in the past

Hyperliquid price remains in a bearish channel ahead of massive $328M token unlock

Hyperliquid price is under pressure as traders brace for a large token unlock scheduled for Jan. 6.

Summary
  • Hyperliquid trades near $26.45, still down 55% from its September peak despite a short-term bounce.
  • Futures volume and open interest are rising, showing cautious positioning rather than strong conviction.
  • A $328M token unlock on Jan. 6 could pressure price, even as ongoing burns offer partial support.

HYPE was trading at $26.45 at press time, up 4% in the past 24 hours. Over the past seven days, the token has fluctuated between $24.03 and $27.18, but it’s still down 15% in the previous month and roughly 55% from its September all-time high of $59.

Trading activity picked up notably. Hyperliquid’s (HYPE) 24-hour spot volume rose 52% to about $236 million. Derivatives data from CoinGlass shows futures volume climbing 28% to $1.21 billion, while open interest edged up 2.1% to $1.43 billion.

This mix suggests fresh positions are being added rather than traders aggressively closing risk. In practice, it points to cautious engagement, not a decisive shift in market direction.

HYPE token unlock approaches 

Attention is now turning to a major supply event. According to Tokenomist data, around 12.46 million HYPE tokens will unlock on Jan. 6. This represents 3.61% of the released supply and is valued at roughly $328 million at current prices.

So far, about 38.3% of the total supply has been released, equal to 345.08 million tokens out of a maximum of 962.05 million.

Such unlocks often raise concerns about short-term selling, especially if recipients decide to take profits. In HYPE’s case, that risk is real, particularly with price still sitting inside a wider downtrend. Added supply can make it harder for rallies to hold, and it may cap upside attempts in the days around the event.

That said, the context matters. The unlock was well-flagged in advance, and its size is small relative to the platform’s daily trading volumes.

Past crypto cycles show that clearly communicated unlocks often lead to selling ahead of the date, followed by stabilization or recovery if demand remains steady. Recent sideways movement in HYPE suggests part of that adjustment may already be underway.

Hyperliquid’s token burn process helps take some pressure off supply. A good portion of protocol revenue is used to buy back and burn HYPE, including a large one-time burn of 37.5 million tokens in late December, worth about $912 million. Beyond that event, burns are continuing at a steady pace, creating an estimated $2 million in daily buyback pressure.

Hyperliquid price technical analysis

HYPE is still trending downward. Lower highs and lows are visible on the chart, and every rebound has been rejected close to a declining trendline. The token is trading below key medium- and long-term moving averages, which continue to slope downward and serve as resistance.

Hyperliquid price remains in a bearish channel ahead of massive $328M token unlock - 1

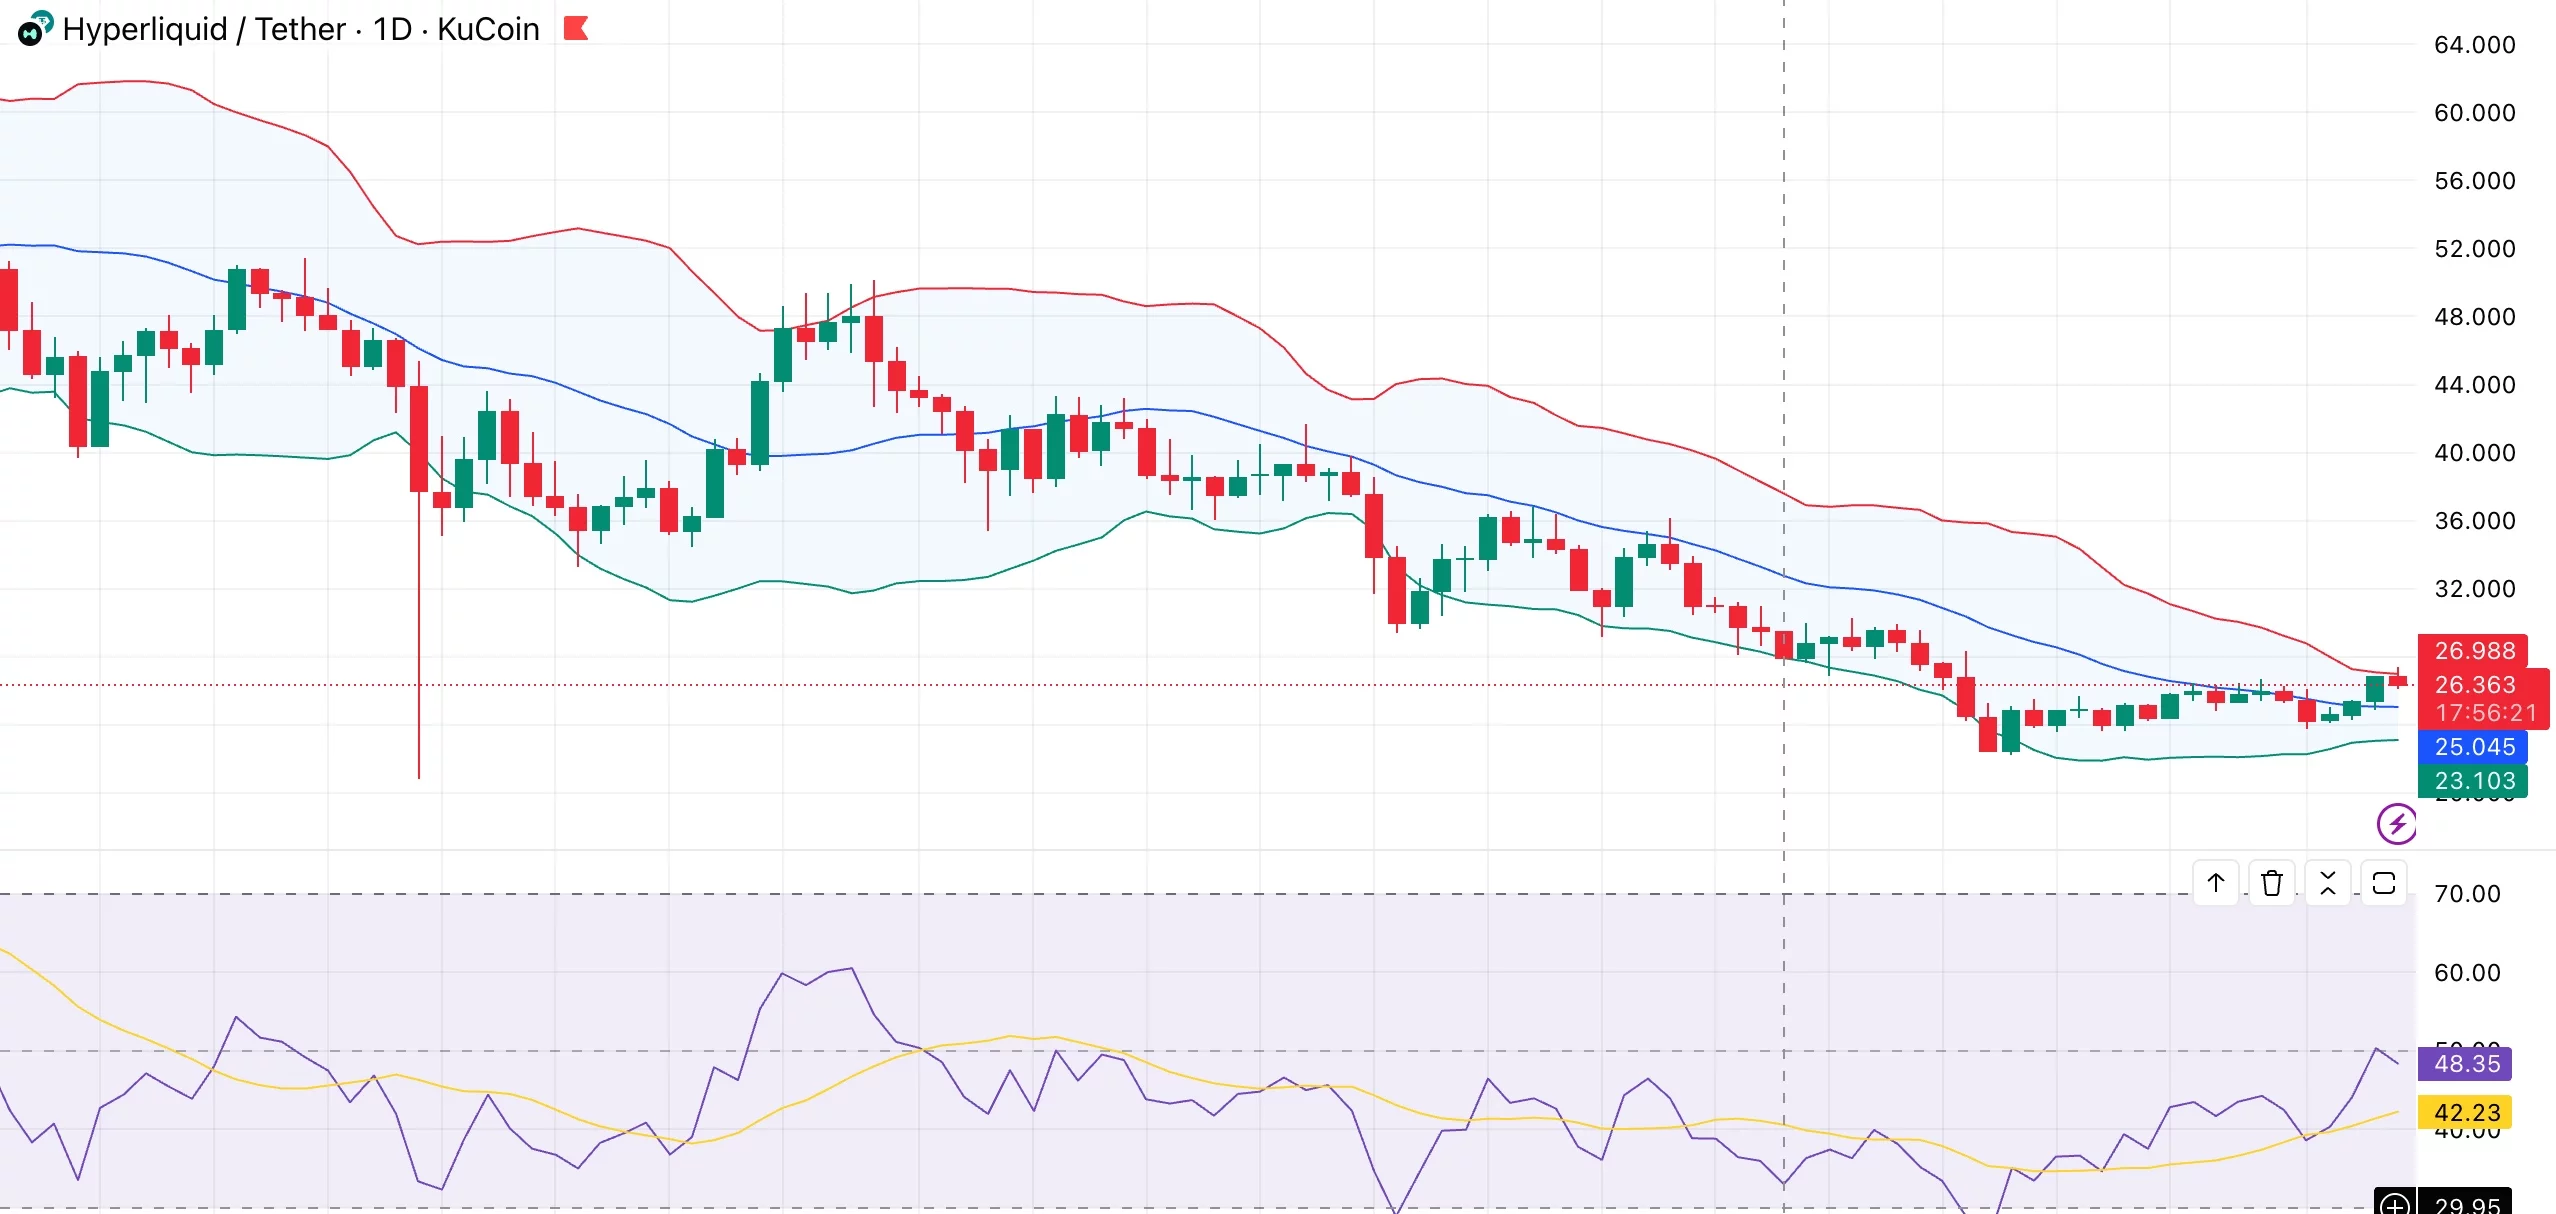
Following a prolonged sell-off, Bollinger Bands have tightened, indicating less volatility. This often precedes a larger move, but with the price sitting in the lower half of the range, the bias appears to be cautious. 

While the relative strength index has recovered from oversold levels, it’s still around 50, indicating that the bearish momentum is lessening but hasn’t completely reversed.

To improve the outlook in the near future, a sustained break above the upper channel and the recovery of the $29–$30 region would be required. If the $24–$25 zone is not maintained, particularly around the unlock, another leg lower may be possible.

Market Opportunity
TokenFi Logo
TokenFi Price(TOKEN)
$0.005231
$0.005231$0.005231
-2.94%
USD
TokenFi (TOKEN) Live Price Chart
Disclaimer: The articles reposted on this site are sourced from public platforms and are provided for informational purposes only. They do not necessarily reflect the views of MEXC. All rights remain with the original authors. If you believe any content infringes on third-party rights, please contact service@support.mexc.com for removal. MEXC makes no guarantees regarding the accuracy, completeness, or timeliness of the content and is not responsible for any actions taken based on the information provided. The content does not constitute financial, legal, or other professional advice, nor should it be considered a recommendation or endorsement by MEXC.

You May Also Like

Last Chance: BlockDAG’s $441M Presale Ends Jan 26, While Cardano & SUI Price Generate Buzz

Last Chance: BlockDAG’s $441M Presale Ends Jan 26, While Cardano & SUI Price Generate Buzz

The crypto market is heating up, and sharp traders are searching for major opportunities before the door closes. Established players like Cardano and rising stars
Share
Techbullion2026/01/08 07:00
Italy becomes first EU country to pass comprehensive AI law

Italy becomes first EU country to pass comprehensive AI law

Italy has formally passed a sweeping new law to regulate artificial intelligence, becoming the first member of the European Union to roll out comprehensive legislation in step with the bloc’s landmark AI Act. The Italian Senate granted final approval after a year of debate, concluding what Prime Minister Giorgia Meloni’s government described as a decisive […]
Share
Cryptopolitan2025/09/18 04:00
Cryptos Signal Divergence Ahead of Fed Rate Decision

Cryptos Signal Divergence Ahead of Fed Rate Decision

The post Cryptos Signal Divergence Ahead of Fed Rate Decision appeared on BitcoinEthereumNews.com. Crypto assets send conflicting signals ahead of the Federal Reserve’s September rate decision. On-chain data reveals a clear decrease in Bitcoin and Ethereum flowing into centralized exchanges, but a sharp increase in altcoin inflows. The findings come from a Tuesday report by CryptoQuant, an on-chain data platform. The firm’s data shows a stark divergence in coin volume, which has been observed in movements onto centralized exchanges over the past few weeks. Bitcoin and Ethereum Inflows Drop to Multi-Month Lows Sponsored Sponsored Bitcoin has seen a dramatic drop in exchange inflows, with the 7-day moving average plummeting to 25,000 BTC, its lowest level in over a year. The average deposit per transaction has fallen to 0.57 BTC as of September. This suggests that smaller retail investors, rather than large-scale whales, are responsible for the recent cash-outs. Ethereum is showing a similar trend, with its daily exchange inflows decreasing to a two-month low. CryptoQuant reported that the 7-day moving average for ETH deposits on exchanges is around 783,000 ETH, the lowest in two months. Other Altcoins See Renewed Selling Pressure In contrast, other altcoin deposit activity on exchanges has surged. The number of altcoin deposit transactions on centralized exchanges was quite steady in May and June of this year, maintaining a 7-day moving average of about 20,000 to 30,000. Recently, however, that figure has jumped to 55,000 transactions. Altcoins: Exchange Inflow Transaction Count. Source: CryptoQuant CryptoQuant projects that altcoins, given their increased inflow activity, could face relatively higher selling pressure compared to BTC and ETH. Meanwhile, the balance of stablecoins on exchanges—a key indicator of potential buying pressure—has increased significantly. The report notes that the exchange USDT balance, around $273 million in April, grew to $379 million by August 31, marking a new yearly high. CryptoQuant interprets this surge as a reflection of…
Share
BitcoinEthereumNews2025/09/18 01:01