MemeCore (M) Trades in a Consolidation Range as Price Stabilizes Near Key Levels
- MemeCore is trading in a narrow range, suggesting short-term consolidation.
- Support near $1.55 and resistance at $1.89 will be key levels to watch.
MemeCore (M) has been moving sideways in recent weeks, with the price currently around $1.69. After a period of decline, the token is now showing early signs of stabilization, trading in a narrow range between support and resistance. The chart suggests that MemeCore may be forming a short-term consolidation pattern, sometimes referred to as a rectangle or range-bound structure, where the price oscillates between defined support and resistance levels.
Over the past 24 hours, the price of this memecoin climbed about 3%, reaching an intraday high of $1.71 and a low of $1.62. Its market cap currently stands at $2.1 billion, with a trading volume of $14.7 million.
Sideways Momentum Suggests the Market Is Taking a Breather
Looking at the 24 hours trading pattern, MemeCore is positioned between the 50-day moving average at $1.555 and the 100-day moving average at $1.889. The 50-day moving average is slowly flattening, indicating that immediate selling pressure is easing. The 100-day moving average remains above the current price, suggesting the broader trend is still slightly weak. Overall, the averages show that the market is in a recovery phase but hasn’t fully returned to an uptrend yet.
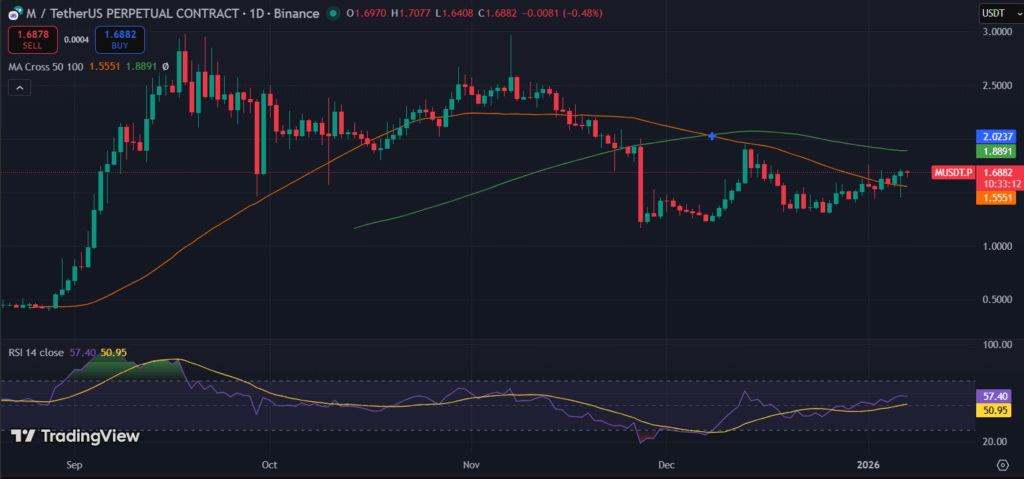 (Source: TradingView)
MemeCore’s daily RSI stands at 57, showing that momentum is mildly positive. This indicates that buyers are gradually returning, but there isn’t a strong push higher yet. The market isn’t oversold or overbought, which fits with the sideways price action seen on the chart.
Immediate support is around $1.55–$1.56, which has helped prevent further declines in recent sessions. A stronger support level exists near $1.50, which could provide a safety net if the price dips further. On the upside, MemeCore’s resistance is seen at $1.89, near the 100-day moving average, followed by $2.02, which previously acted as a barrier. Breaking above these levels would be necessary for any meaningful upward movement.


You May Also Like

Is Trump Manipulating the Crypto Market?

Robotics Automation Prototyping: Engineering Kinetic Agility into End-Effectors