

Bitcoin Price Drops Below $92K as Rally Shows Signs of Exhaustion—Is This a Bull Trap?

The post Bitcoin Price Drops Below $92K as Rally Shows Signs of Exhaustion—Is This a Bull Trap? appeared first on Coinpedia Fintech News
Bitcoin has started 2026 with a sharp rebound, rising for five consecutive sessions and adding nearly $100 billion in market capitalization. The move has reignited optimism across the crypto market, with many traders now arguing that the $81,000 level marked a definitive cycle bottom.
However, a closer look at market structure, on-chain behaviour, and macro conditions suggests this rally may be fragile. Currently, the BTC price has reversed sharply, sliding below $91,300. This pullback is compelling the traders to think about whether the recent move is a trend reversal or a short-lived relief rally.
Altcoins Leading Raises Early Warning Signs
One of the first red flags is market leadership. In past bull cycles, Bitcoin typically rallies first, with dominance rising as capital concentrates in the most liquid asset. Only later does money rotate into altcoins.
This time, the opposite is happening; altcoins are outperforming, Bitcoin dominance is trending lower and the risk appetite has expanded unusually fast. Historically, this pattern has appeared during bear-market rallies, not at the start of sustained uptrends.
Whale Behavior Suggests Distribution, Not Accumulation
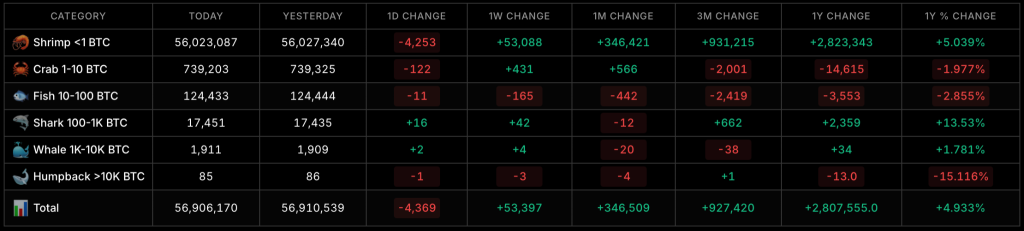
On-chain wallet distribution data adds further weight to the cautious outlook. Addresses holding 100–1,000 BTC — often tracked as a proxy for institutional and high-conviction investors—are not showing meaningful accumulation despite the recent pullback in price.
 Source: Newhedge
As shown in the chart, the number of BTC Fish (10–100 BTC), Sharks (100–1,000 BTC), Whales (1,000–10,000 BTC), and Humpbacks (>10,000 BTC) has declined over the past month, indicating continued distribution across large-holder cohorts. Notably, the whale category has fallen by 20 addresses over the past month, while only four new whale wallets were added over the past week and just two in the last 24 hours.
This muted recovery suggests that large holders are not aggressively stepping in, even as Bitcoin retraces into a potential demand zone. In previous cycle bottoms, this cohort typically accumulated early and decisively. The absence of that behavior this time implies that recent strength may still be driven by short-term positioning rather than long-term conviction.
Bitcoin Demand Has Yet to Recover
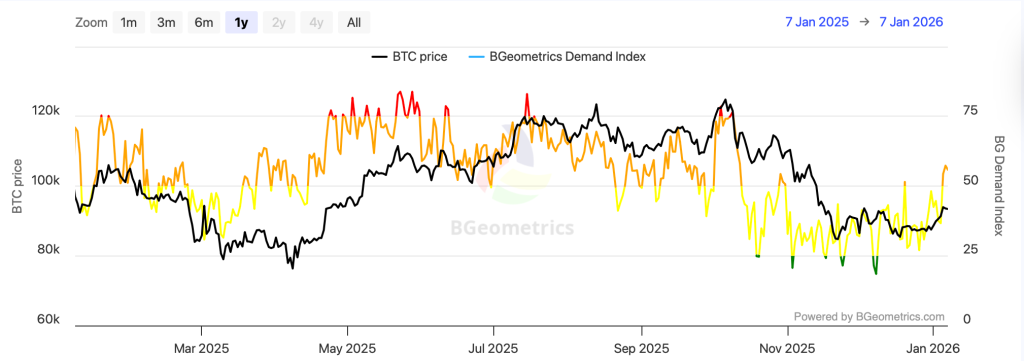
Another key metric still pointing lower is Bitcoin’s apparent demand, which tracks net BTC accumulation by active market participants. The chart highlights a clear price-dependent demand pattern in Bitcoin. Demand, as measured by the BGeometrics Demand Index, strengthens only when BTC decisively trades above the $100,000 level, coinciding with strong upside momentum. Each sustained push above this range is followed by a visible rise in demand, suggesting buyers step in primarily during breakouts rather than during consolidation.
 Source: BGeometrics
Conversely, when Bitcoin falls back below $100,000 or moves sideways, demand consistently weakens. Prolonged consolidation phases are marked by declining demand readings, indicating reduced spot participation and a lack of follow-through buying. This behavior suggests recent rebounds are being driven more by price momentum than organic accumulation. This reinforces the view that demand remains reactive rather than leading.
The current rally fits that historical pattern. Demand has not yet reversed, suggesting the move lacks long-term sponsorship from committed buyers.
A Familiar Technical Pattern Is Emerging
From a technical perspective, Bitcoin is also tracing a well-known setup. Although the BTC price surged magnificently since the start of the month, it failed to clear a pivotal resistance zone. This zone between $93,700 and $94,500 has now become a key inflexion point. Therefore, a rejection from this zone could attract more bearish action in the coming days.
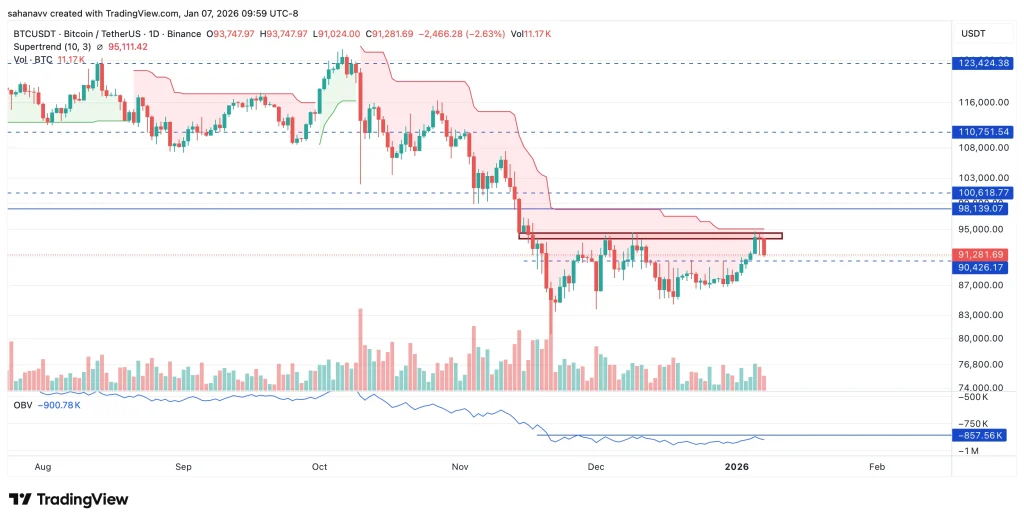
As seen in the above chart, the BTC price not only failed to surpass the resistance zone but also the supertrend. With this, the bearish influence continues to hover over the price, while the bearish divergence in the OBV substantiates the claim. However, the volume has remained consistent since December. This suggests the local support at $90,426 could act as a strong base if the pullback continues.
Final Take: Is This a Bull Trap or Just a Cooling Phase?
Bitcoin (BTC) price remains in a tight consolidation with downside risk unless bulls reclaim key resistance. Repeated rejections near $93,500–$95,000 suggest sellers are still active, while $90,400 remains the level holding the structure together. A breakdown below this support could expose $87,000 and $83,000–$80,000. Only a strong daily close above $98,000–$100,600 would invalidate the bearish bias and shift momentum back toward $110,000.


You May Also Like

Standard Chartered (STAN.L) Stock; Rises as $12M A*STAR AI Lab Boosts Innovation

Vanguard Increases Strategy Stake to $255M as MSTR Adds $2.54 Billion Bitcoin


