

Bitcoin Price Nears Losing $90,000: Deeper Sell-Off Could Be Coming Next

Bitcoin’s recent price rebound proved short-lived, as the crypto king quickly retraced to early January levels after a brief rally. The abrupt reversal has reignited concerns about market fragility.
The failure to sustain higher levels reflects lingering uncertainty of whether the bounce marked a true transition out of the prior bearish phase or merely a temporary relief rally within a broader downtrend.
Bitcoin Holders Lack Conviction
The Short-Term Holder Cost Basis model continues to serve as a crucial reference point during transitional phases. In December, Bitcoin established a fragile equilibrium near the lower bound of this model, close to the −1 standard deviation band. That positioning reflected elevated downside sensitivity and weak conviction among recent buyers.
The subsequent rebound lifted the price back toward the model’s mean. This level aligns with the Short-Term Holder Cost Basis near $99,100. Historically, reclaiming this zone signals improving confidence among newer market participants and a shift toward healthier trend dynamics.
Want more token insights like this? Sign up for Editor Harsh Notariya’s Daily Crypto Newsletter here.
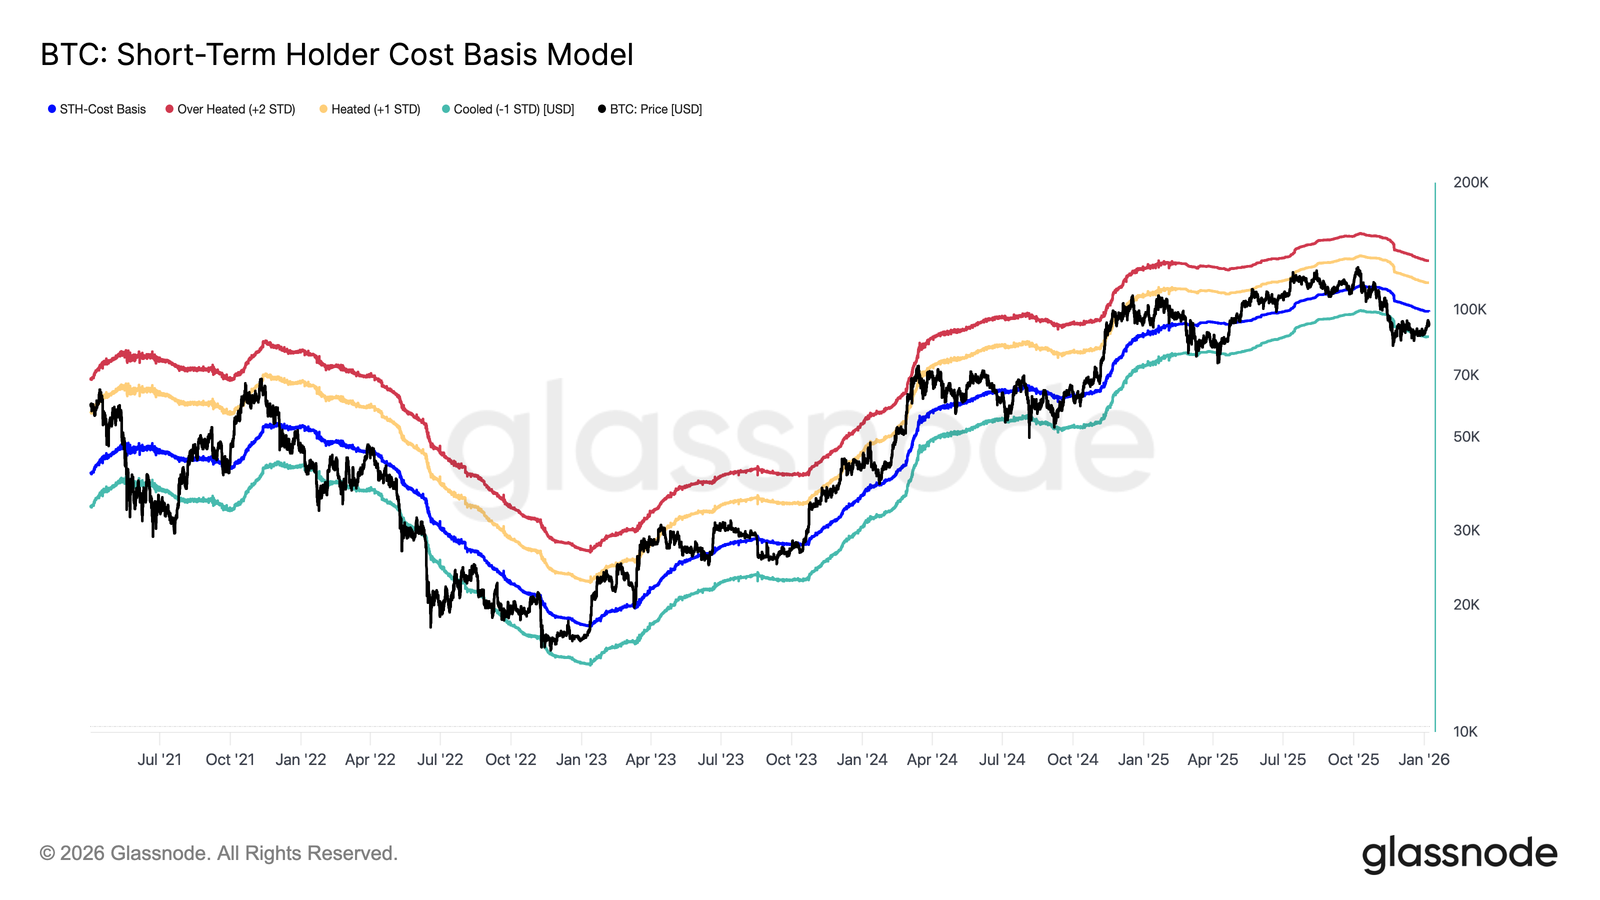 Bitcoin STH Cost Basis. Source: Glassnode
At present, Bitcoin remains well below that threshold. Until price can sustain a move above the Short-Term Holder Cost Basis, recovery signals remain incomplete. Without this confirmation, the market risks slipping back into defensive positioning rather than transitioning into accumulation.
BTC Reversal Warrants Further Decline
Momentum indicators also suggest that a full recovery may still be distant. On shorter time frames, Bitcoin reversals have historically coincided with the Relative Strength Index falling to 38.1 or lower. These conditions typically reflect capitulation among weaker hands.
Currently, RSI levels have not reached that zone. This suggests selling pressure may not yet be fully exhausted. Without a deeper reset in momentum, upside attempts risk fading as sellers regain control.
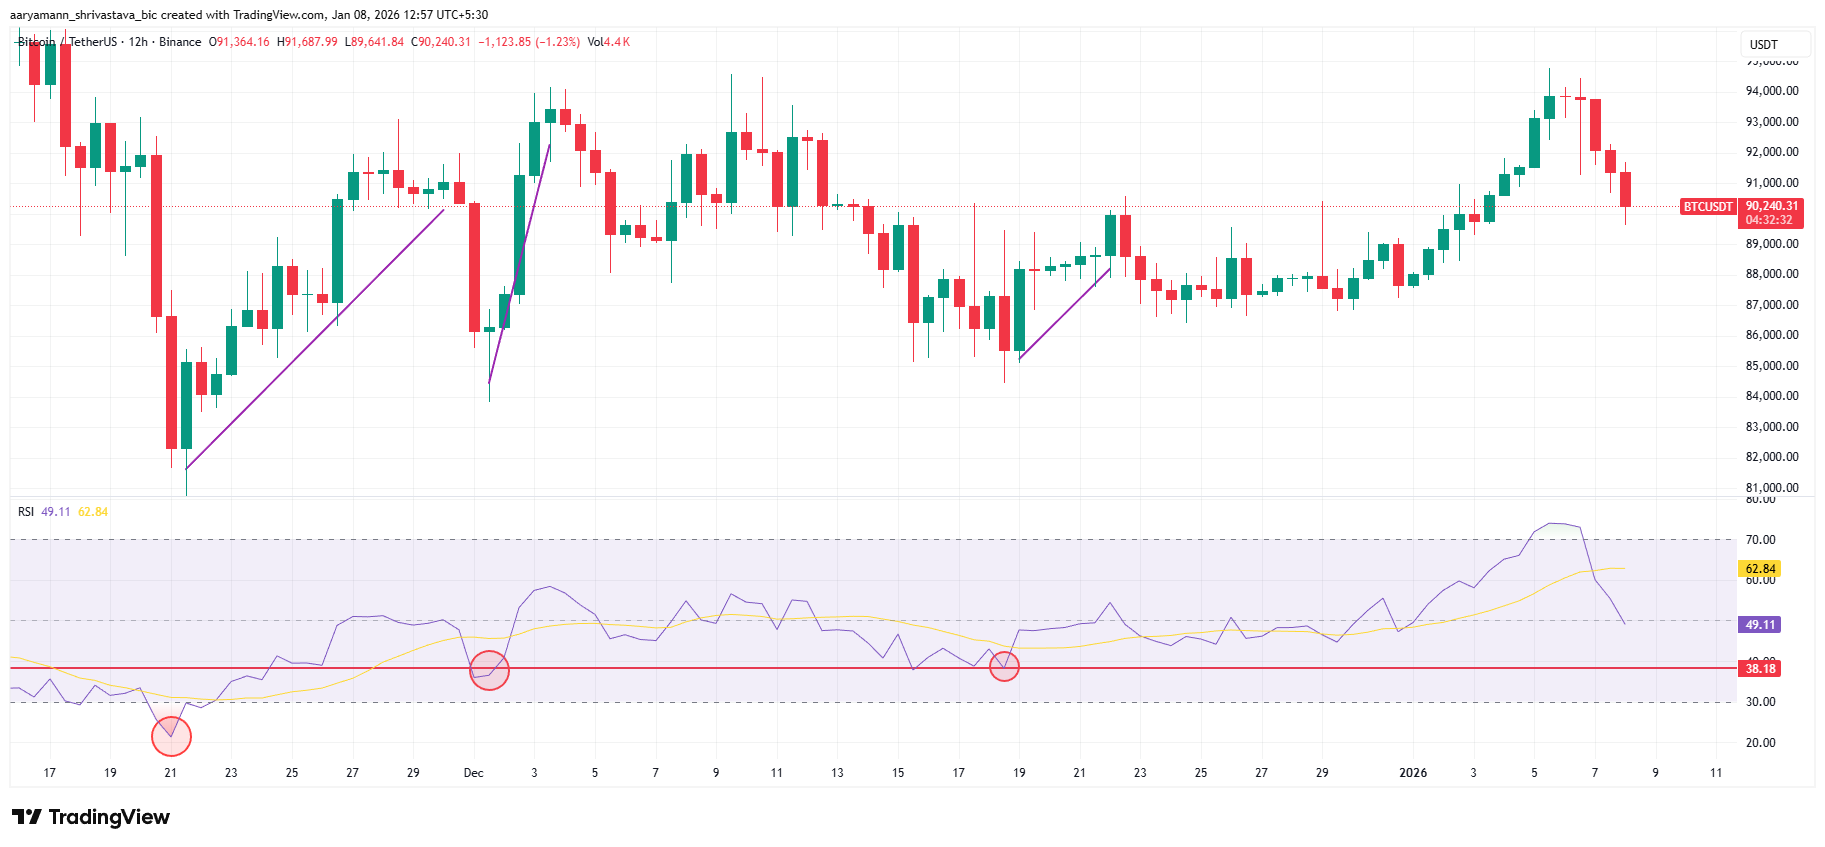 Bitcoin RSI. Source: TradingView
For Bitcoin to stage a sharper recovery, historical patterns imply further downside may be required. Such a move could flush remaining leverage and reset sentiment. Until then, rebounds may struggle to gain durability.
What Do Bitcoin Traders Have To Lose?
Derivatives data highlights additional risk beneath the surface. The liquidation map displays a notable concentration of long liquidations at approximately $86,200. Roughly $2.13 billion in leveraged long positions are currently at this level.
If Bitcoin price declines toward that zone, forced liquidations could trigger a cascading sell-off. Such events often accelerate price drops, as leverage unwinds quickly and sentiment deteriorates.
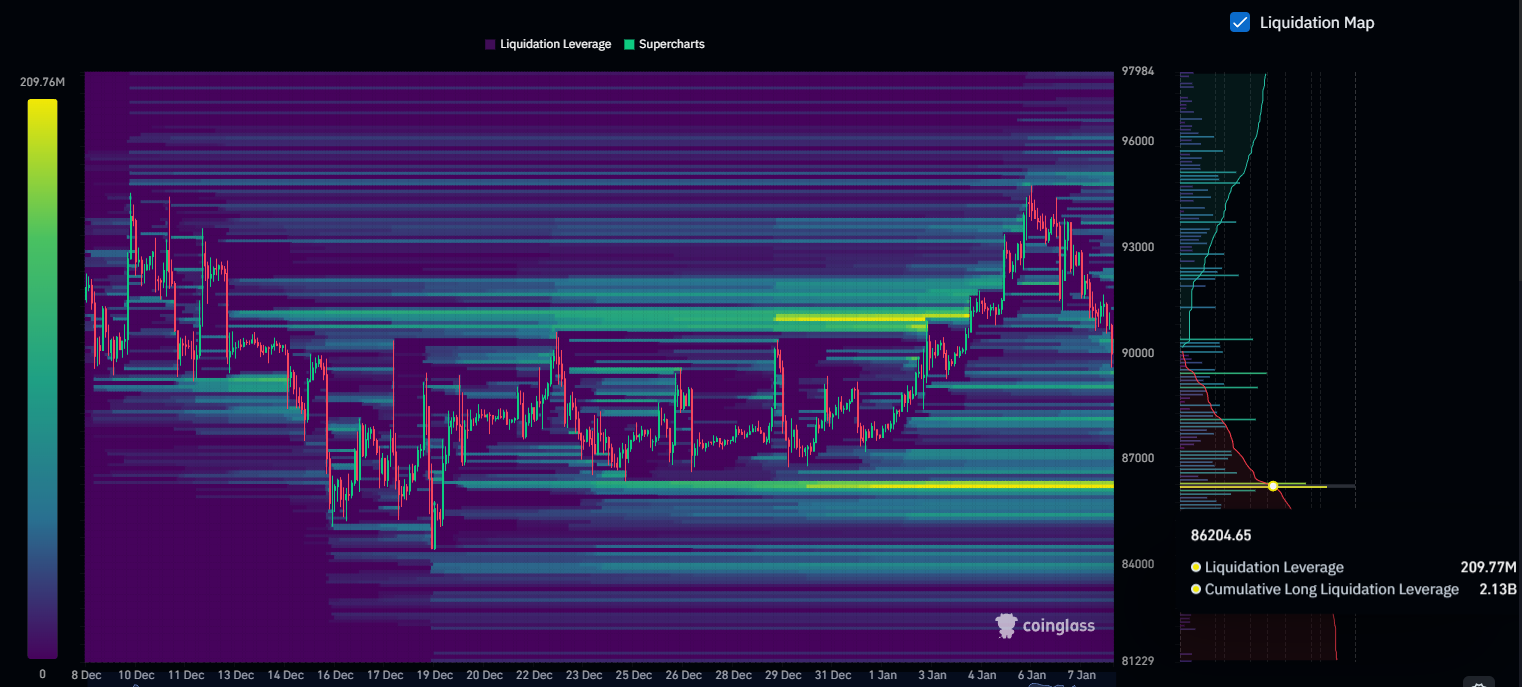 Bitcoin Liquidation Heatmap. Source: Coinglass
This dynamic increases downside vulnerability during periods of weakness. While liquidation clusters can act as magnets, they also represent areas of heightened volatility. A breakdown into this zone would likely intensify fear across the market.
BTC Price Risks Slipping Below This Support
Bitcoin trades near $90,146 at the time of writing, holding just above the $90,000 psychological level. This support remains critical in the short term. A decisive loss of $90,000 would likely push BTC toward $89,241, reopening downside momentum.
If bearish conditions intensify due to macro uncertainty, weak demand, or renewed selling, Bitcoin could break below $89,241. In that scenario, attention would shift to $87,210, a level tested multiple times. The most critical support sits near $86,247, where prior sell-offs have stalled. Losing this level would expose the market to $2.13 billion in long liquidations.
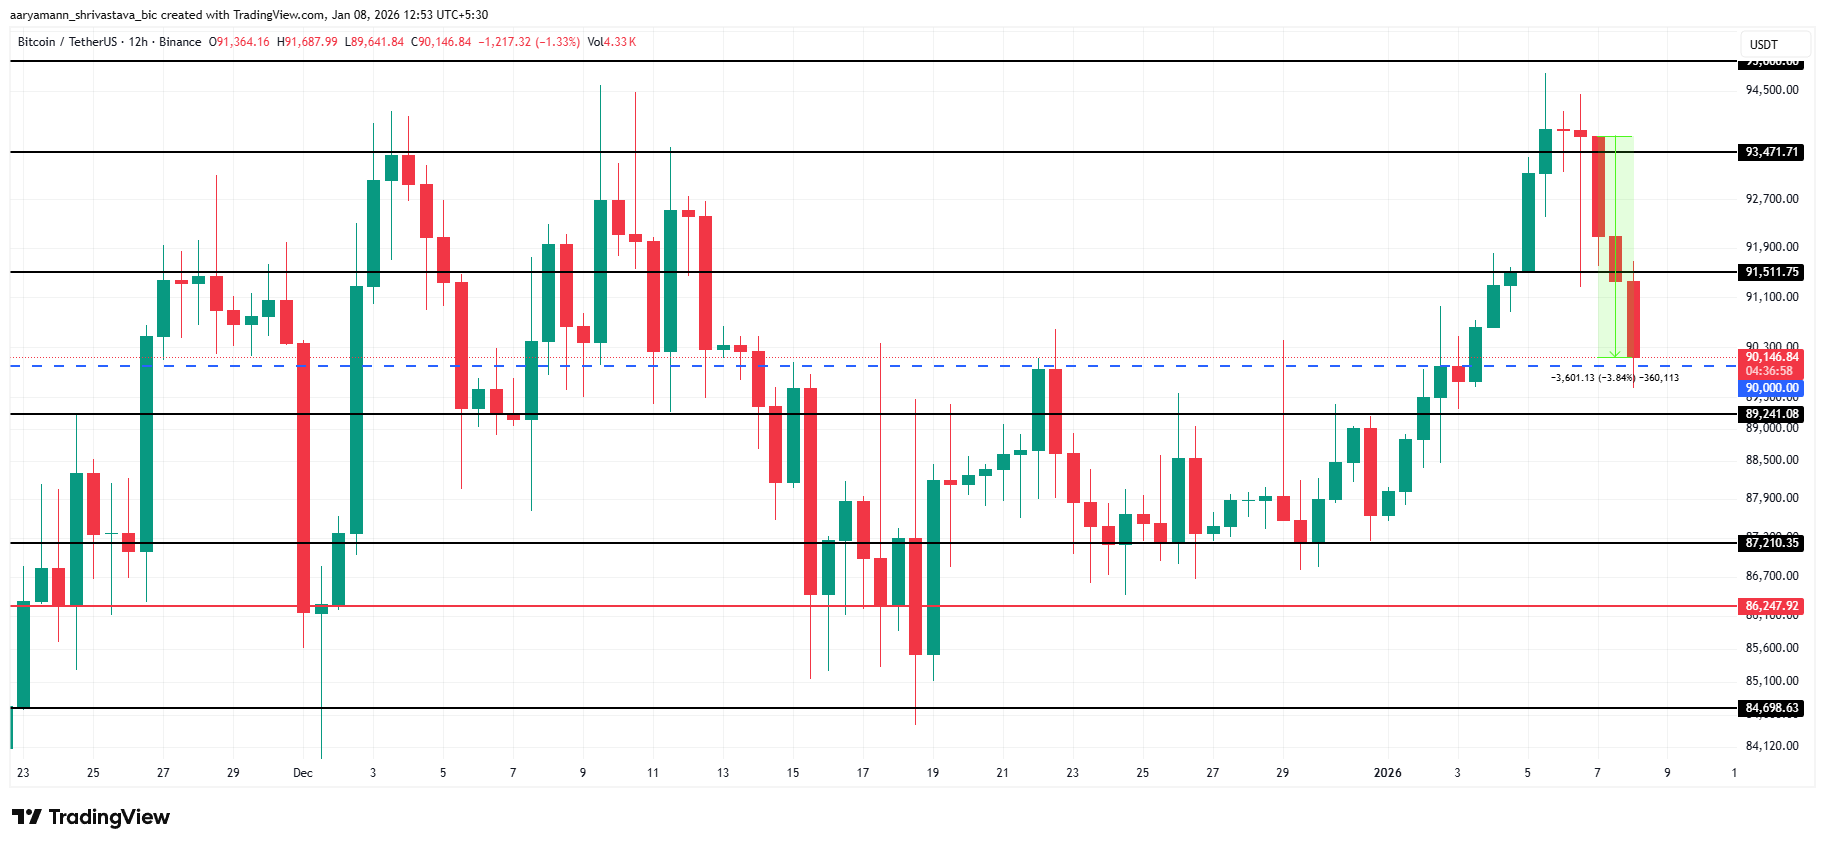 Bitcoin Price Analysis. Source: TradingView
A bullish alternative remains viable if buyers regain control. Should Bitcoin bounce from $90,000 and reclaim $91,511, previously tested resistance, momentum could shift. Holding above that level would open a path toward $93,471, allowing BTC to recover recent losses and invalidate the bearish thesis in the short term.


You May Also Like
Ethereum Eyes Breakout As $1,400 to $1,800 Zone Sparks Bull Cycle Hopes Now

Central banks to raise rates amid inflation from Iran’s oil supply cuts: FT


