The post Solana Attempts a Rebound as Consolidation Nears End—Can SOL Price Break the $145 Barrier? appeared first on Coinpedia Fintech News Solana is one of theThe post Solana Attempts a Rebound as Consolidation Nears End—Can SOL Price Break the $145 Barrier? appeared first on Coinpedia Fintech News Solana is one of the

Solana Attempts a Rebound as Consolidation Nears End—Can SOL Price Break the $145 Barrier?

2026/01/09 03:48
2 min read
Solana trader turns $321 into $2.18 million

The post Solana Attempts a Rebound as Consolidation Nears End—Can SOL Price Break the $145 Barrier? appeared first on Coinpedia Fintech News

Solana is one of the most closely watched cryptos since its breakout in 2021, attracting sustained interest from retail traders, whales, and institutions. Since the start of 2026, sentiment surrounding SOL price has become increasingly optimistic, supported by rising institutional engagement, including ETF-related filings involving major financial players, as well as continued network upgrades and ecosystem expansion. The growing adoption of DeFi, tokenisation initiatives, and broader Solana-based projects has reinforced the long-term bullish narrative.

Despite these tailwinds, SOL has struggled to establish a firm base above the $145–$150 zone. Following the pullback from the 2025 highs, sellers successfully pushed the price below $150, transforming it into a supply zone. Repeated rejections from this range indicate active distribution, with bears defending the level aggressively. Until SOL can reclaim and hold above this supply band, upside attempts are likely to remain capped.

solana price

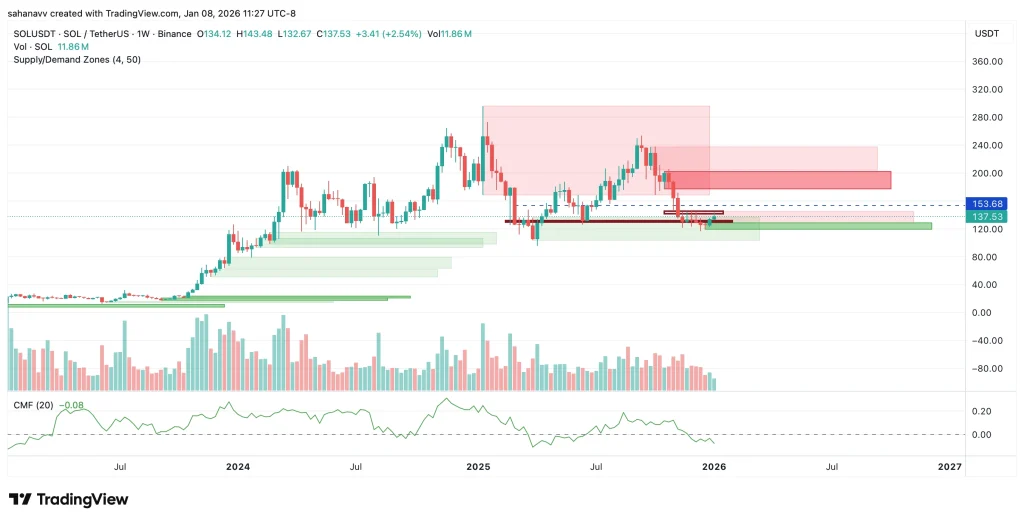
As seen in the chart, Solana price has remained range-bound for several months, oscillating between well-defined support and resistance zones. Buying interest has consistently emerged between $128 and $119, reinforcing demand below the $131–$128 support band. However, upside attempts continue to stall within the $130–$144 supply zone, where repeated sell-offs point to sustained distribution. This persistent supply has prevented SOL from reclaiming the $145 resistance, a level that would be critical to opening the path toward $150 and above. For now, liquidity appears to be thinning, with the Chaikin Money Flow (CMF) showing a notable bearish divergence.

Despite this near-term pressure, momentum indicators are beginning to tilt in favor of the bulls. The MACD signals waning selling pressure and hints at a potential bullish crossover. Besides, the RSI is attempting to recover toward higher levels, suggesting strengthening upside momentum. These developments indicate that SOL may be quietly building strength, and a sustained pickup in volume could support a push back toward the $145–$150 range.

The broader structure suggests Solana (SOL) price is in a consolidation phase rather than a trend reversal. From a wider perspective, this prolonged range could be laying the groundwork for a stronger bullish expansion once key resistance levels are decisively reclaimed.

Market Opportunity
Solana Logo
Solana Price(SOL)
$87.84
$87.84$87.84
+2.19%
USD
Solana (SOL) Live Price Chart
Disclaimer: The articles reposted on this site are sourced from public platforms and are provided for informational purposes only. They do not necessarily reflect the views of MEXC. All rights remain with the original authors. If you believe any content infringes on third-party rights, please contact crypto.news@mexc.com for removal. MEXC makes no guarantees regarding the accuracy, completeness, or timeliness of the content and is not responsible for any actions taken based on the information provided. The content does not constitute financial, legal, or other professional advice, nor should it be considered a recommendation or endorsement by MEXC.

You May Also Like

Standard Chartered Predicts a $2 T Stablecoin Cap by 2028 as BTC Faces a Fair Value Gap 📊

Standard Chartered Predicts a $2 T Stablecoin Cap by 2028 as BTC Faces a Fair Value Gap 📊

👋 Welcome to the CoinStats Scoop, your weekly newsletter with the most groundbreaking Web3 innovations and market-moving headlines in the crypto space.Stay in the
Share
Coinstats2026/02/26 15:57
Surging Crypto Prices Spark Wide-Scale Liquidations

Surging Crypto Prices Spark Wide-Scale Liquidations

The post Surging Crypto Prices Spark Wide-Scale Liquidations appeared on BitcoinEthereumNews.com. In an unexpected rally, the cryptocurrency market saw substantial
Share
BitcoinEthereumNews2026/02/26 16:04
Cardano Price Will ‘Break the Internet’ to $20: Here is Why

Cardano Price Will ‘Break the Internet’ to $20: Here is Why

The post Cardano Price Will ‘Break the Internet’ to $20: Here is Why appeared on BitcoinEthereumNews.com. Key Insights: A 10x to 20x Cardano price rally aligns with both technical setup and historical growth cycles. The relative performance chart for ADA indicates that 2023 brought significant gains, and while 2024 saw some retracement, the broader trend remains intact. Cardano (ADA) market cap rose to $33.34 billion. Cardano price has been gaining strong momentum in recent weeks, with analysts pointing to a potential 10x–20x breakout. Backed by solid technical patterns, growing institutional exposure, and increasing network activity, ADA is positioning itself as one of the most promising altcoins in the current market cycle. Analyst Predicts Cardano Price Rally by 10X – 20X Cardano price shows strong signs of a major breakout on the 1-day chart as it consolidates within a long-term resistance trendline. Now, it is testing this level with higher lows, which often signals that buyers are gaining strength. Once ADA price breaks above this line, momentum could accelerate quickly. In addition, the price has held steady near the $0.90 region despite market volatility. This stability suggests strong support from long-term holders. If ADA pushes past the $1.20–$1.50 range, the next resistance zone sits much higher, leaving room for explosive upside, as per an analysis by Mr P Crypto. Cardano Price Analysis | Source: Mr P Crypto, X A Closer Look into ADA Price & Performance Furthermore, the relative performance chart indicates that 2023 brought significant gains, and while 2024 saw some retracement, the broader trend remains intact. With renewed demand and increasing development activity on the Cardano network, investors may soon see rapid appreciation. Therefore, if ADA follows the same pattern of previous bull runs, a move toward $10 or even $20 is not unrealistic. A 10x to 20x increase would align with both the technical setup and historical growth cycles. In short, Cardano price looks…
Share
BitcoinEthereumNews2025/09/19 16:13