

Solana (SOL) Price: Platform Surpasses Ethereum In Tokenized Stock Market Share
TLDR
- Solana leads tokenized stocks with $874 million market cap, beating Ethereum and BNB Chain in the $1.2 billion tokenized stock market
- SOL price pulled back to $130 support level, with analysts targeting $250 if support holds
- US spot Solana ETFs recorded $41.08 million net weekly inflow through Thursday, the highest since mid-December
- Morgan Stanley filed S-1 registration statements with SEC for spot Bitcoin and Solana ETFs
- Wyoming’s state-issued stablecoin FRNT launched on Solana network, showing institutional trust
Solana has become the leading blockchain platform for tokenized stocks by market capitalization. The network currently holds approximately $874 million in tokenized equities, representing the majority of the $1.2 billion tokenized stock market.
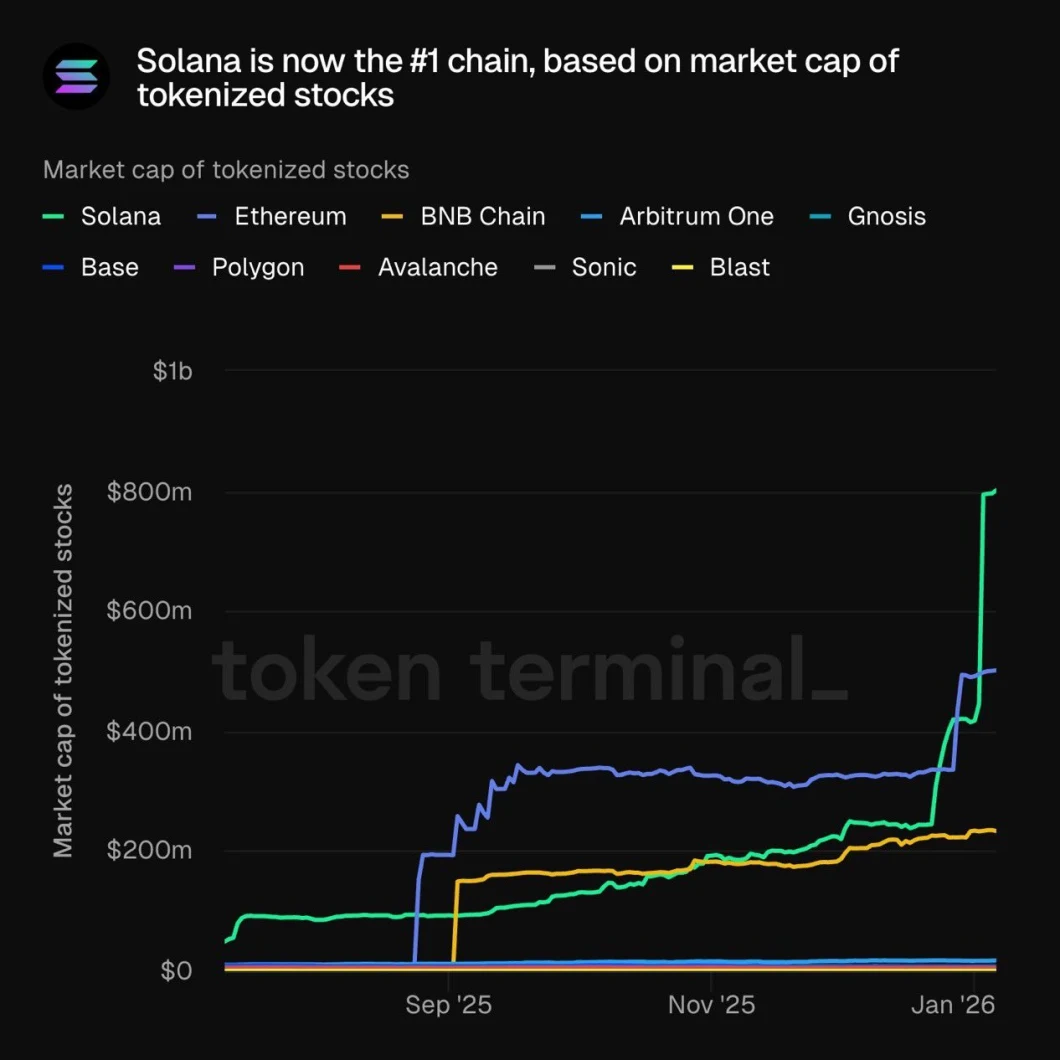 Source: Token Terminal
The platform has overtaken Ethereum and BNB Chain in this sector. Tokenized stocks are digital versions of traditional stocks that trade 24/7 with instant settlement. Solana-based products like ETFs, Tesla’s TSLAx, and Circle’s CRCLx have contributed to this growth.
The SOL token recently pulled back to around $130, which analysts view as a potential entry point for investors. Crypto analyst curb.sol noted this as a healthy correction following recent price increases. The $130 level represents a key support zone for the asset.
If the support holds, analysts believe SOL could move toward $250. The pullback is seen as a natural market process that helps establish stronger support levels.
ETF Inflows Show Strong Demand
US-listed spot Solana ETFs have recorded $41.08 million in net weekly inflows through Thursday. This marks the highest weekly inflow since mid-December and continues the positive trend since the ETFs launched on October 28.
Total net assets in these ETFs reached $1.10 billion this week. The consistent inflows suggest growing institutional interest in the asset.
Morgan Stanley filed S-1 registration statements with the SEC for spot Bitcoin and Solana ETFs on Wednesday. This move indicates increasing interest from Wall Street investors in crypto products.
The Wyoming Stable Token Commission launched FRNT, the first US state-issued stablecoin, on the Solana network this week. This represents growing institutional confidence in Solana’s infrastructure.
Technical Analysis Points to Potential Rally
SOL price closed above the weekly resistance level at $126.65 on January 2. The token rose nearly 12% over the next five days, moving above the 50-day Exponential Moving Average at $136.75.
The price briefly dipped on Tuesday to retest the 50-day EMA before rebounding. As of Friday, SOL trades above $139.
The Relative Strength Index stands at 61 on the daily chart, above the neutral 50 level. The Moving Average Convergence Divergence indicator shows a bullish crossover with rising green histogram bars.
On the weekly chart, the MACD remains in negative territory at -14.46, though the histogram is shrinking. The RSI sits at 40.50, below 50 but not in oversold territory. Price consolidation is occurring between $133 and $143.
Bulls are targeting the $160 resistance level if the current upward trend continues. If SOL corrects, the 50-day EMA at $136.75 could provide support.
The post Solana (SOL) Price: Platform Surpasses Ethereum In Tokenized Stock Market Share appeared first on CoinCentral.


You May Also Like

Fatal police violence may have declined for the first time in years

Ripple (XRP) vs Solana (SOL): Which Altcoin Has Greater Potential in Q2 2026?


