

Will a Vital Data Point Spark Bitcoin’s Next Parabolic Surge?

Bitcoin’s Long-Term Holding Phase Shows Signs of Stabilization After Historic Distribution
After a tumultuous 2025 marked by aggressive distribution from long-term Bitcoin holders, on-chain data suggests that selling pressure may be abating. This potential pause in liquidation could signal the beginning of a new bullish wave for Bitcoin, following a year of significant supply resets and market upheaval.
Key Takeaways
- Long-term holders distributed approximately $300 billion worth of Bitcoin in 2025, representing a historic reset of supply.
- Heavy selling by long-term holders tended to occur near market cycle peaks or during structural transitions, rather than at the onset of new downtrends.
- The current stabilization indicates that next market direction may depend on how quickly long-term holder supply consolidates.
- Recent on-chain metrics hint at potential bottoming, paving the way for possible future rallies.
Historic Unwind and Market Volatility in 2025
In 2025, Bitcoin experienced one of its most intense on-chain distribution phases, with nearly $300 billion of dormant Bitcoin—held untouched for over two years—re-entering circulation. Between November 15 and December 14, this period marked a peak in long-term holder (LTH) distribution not seen in over five years. The data reflects a significant transition period amid broader market volatility.
Long-term holder distribution seen during 2025’s major market adjustmentsHistorically, sharp declines in LTH supply have coincided with turbulent phases, often during exhaustion or structural shifts. For example, in 2018, the supply decreased from 13 million BTC to 12 million BTC amidst a prolonged downtrend, with heavy distribution peaking in December. Despite this, Bitcoin bottomed near $3,500 in early 2019 and recovered to $11,000 by mid-year, illustrating that major sell-offs by long-term holders can precede recovery rather than signal an end to bullish cycles.
The 2020–2021 cycle differed—long-term holder supply fell from 13.7 million to 11.65 million BTC during a rally that saw Bitcoin surge from $14,000 to $61,000. Heavy distribution occurred amid rising prices, eroding momentum gradually before the cycle reversed, demonstrating that distribution can accompany expansion phases.
During the 2024–2025 bull run, supply declined from 15.8 million to 14.5 million BTC, with the 30-day distribution peak at 758,000 BTC. Price peaked in March before stabilizing through Q2 and Q3. But in late 2025, the sale intensified, with the supply briefly recovering to 15.4 million BTC in June before collapsing to 13.5 million BTC by December—a record decline indicating capitulation rather than profit-taking.
Implications of the Current Pause in Selling
Since December, LTH supply has stabilized around 13.6 million BTC, coinciding with a sideways trading range for Bitcoin. The long-term/short-term holder supply ratio, which often signals market bottoms or base-building phases when it drops below –0.5, also points to a consolidation phase. In December, the ratio dipped to approximately –0.53, with volatility waning and momentum stalling—indicators of a market reset rather than an ongoing downtrend.
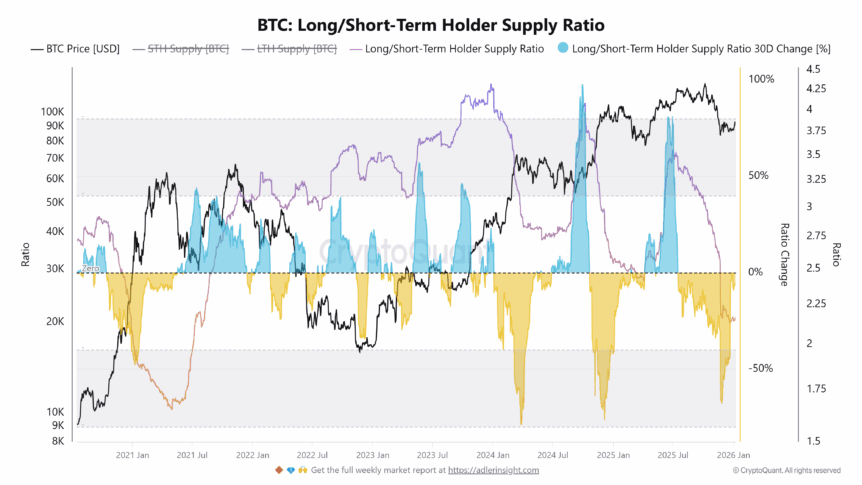 Supply ratio indicating a potential market stabilization
Historically, such aggressive distribution followed by supply stabilization marks transition phases rather than sustained trend continuation. If this pattern repeats, the consolidation through Q1 and Q2 could serve as a foundation for a future rally, potentially emerging later in Q3, signaling renewed bullish momentum.
This article was originally published as Will a Vital Data Point Spark Bitcoin’s Next Parabolic Surge? on Crypto Breaking News – your trusted source for crypto news, Bitcoin news, and blockchain updates.


You May Also Like
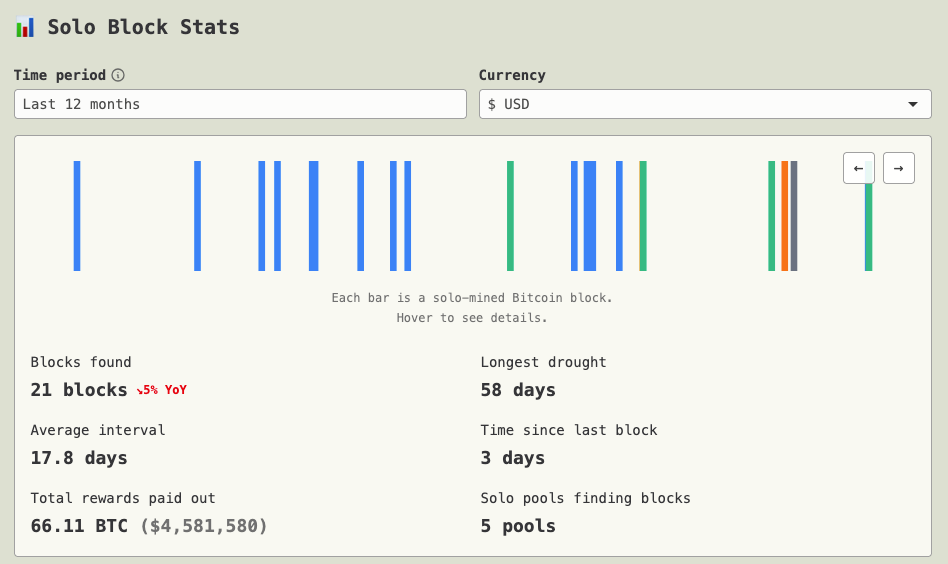
Tiny Bitcoin Miner Defies Odds, Scores $210K Block Reward

Canadian Dollar outperforms as Trump’s address boils oil again


