Ethereum Price Prediction: Bulls Target $3,700 on Triangle Breakout
TLDR
- Ethereum price slipped below $3,200 and is testing key support near the $3,020–$3,050 zone.
- A daily ascending triangle suggests a potential bullish breakout above $3,300.
- Triangle measured move targets the $3,700 area if resistance is cleared.
- Rising institutional staking and treasury accumulation support ETH’s long-term outlook.
Ethereum (ETH) price is navigating a technically complex phase as short-term weakness contrasts with strengthening structural and institutional signals. Analysts have highlighted key support tests near $3,000 alongside a developing triangle breakout targeting higher levels. Institutional staking demand and treasury accumulation continue to shape the broader outlook.
Ethereum Price Tests Support After Losing $3,200
According to analyst Ted Pillows, Ethereum price has slipped below the key $3,200 support after a sharp November pullback. This level previously acted as a major support-resistance flip. Increased sell-side volume suggests near-term distribution rather than trend failure.
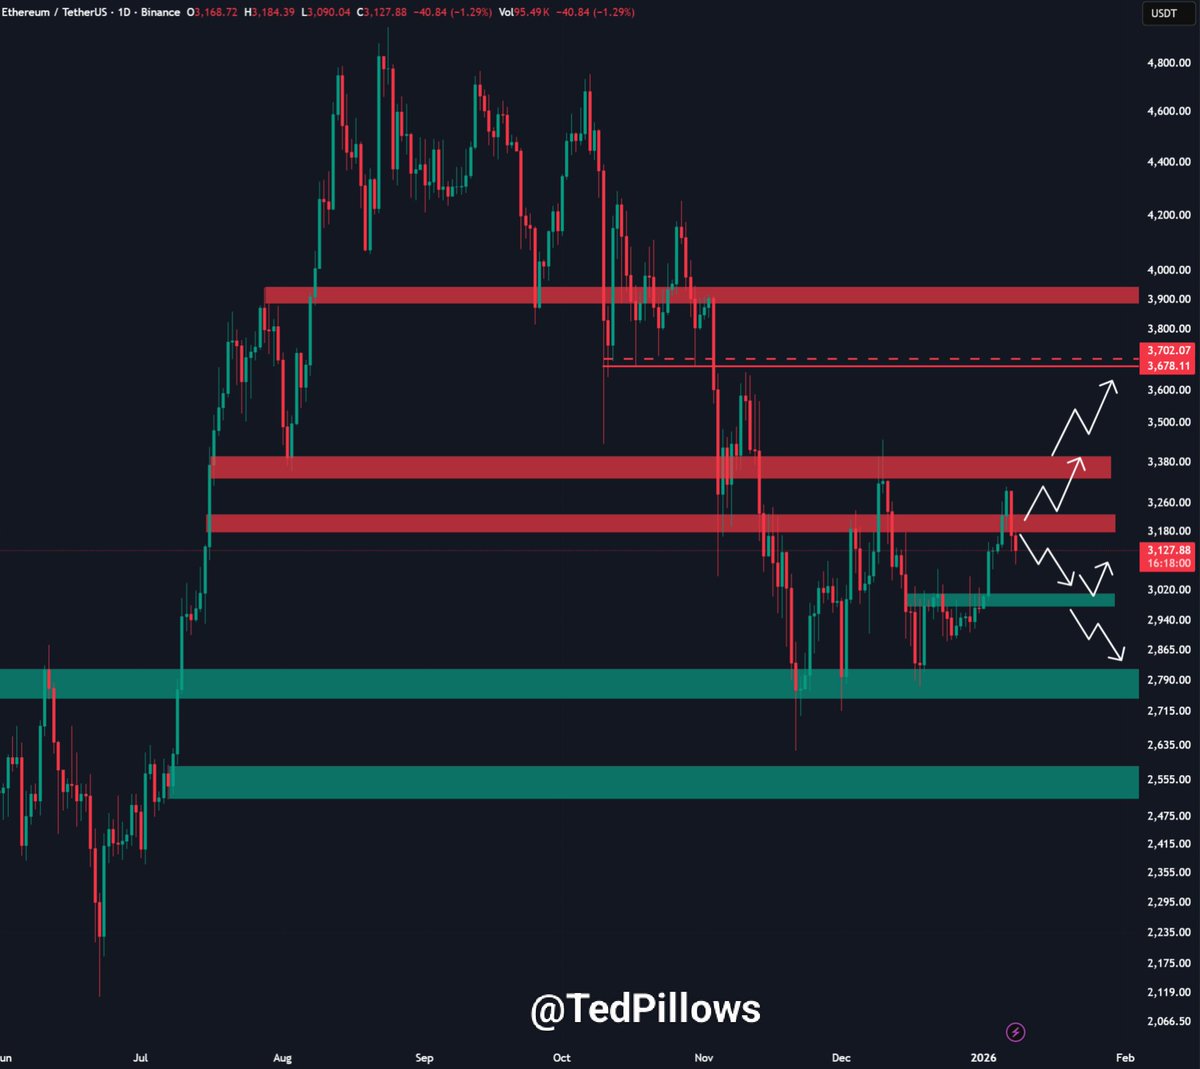
Additionally, price is approaching the $3,020–$3,050 zone, which aligns with prior September and October lows. This zone represents the next critical support. A reaction here could flush weak hands before a potential reversal. Failure to hold would expose a deeper downside toward $2,700.
Moreover, the analyst noted that on-chain data diverges from price weakness. ETH staking queues have reached two-year highs, indicating strong institutional accumulation. Recent inflows include BlackRock’s $82.9 million ETH deposit and BitMine’s $400 million staking addition. These flows support the view that Ethereum price remains underpinned despite short-term pressure.
Ethereum Price Triangle Signals Upside Resolution
In the meantime, according to analyst Ali Martinez, Ethereum price is compressing within an ascending triangle on the daily chart. Flat resistance near $3,300 meets rising support from the $2,500 base. Volatility contraction near the apex suggests a directional move is approaching.
SOURCE: X
In addition, declining volume during consolidation aligns with classical triangle behavior. The structure favors bullish continuation if price confirms acceptance above resistance. A daily close above $3,300 would validate the breakout. The measured move projects a primary target near $3,730.
Furthermore, the setup allows for intermediate reactions. Levels near $3,330 and $3,170 may act as short-term resistance or pullback zones. Downside risks remain if a false breakout occurs, potentially dragging price toward $2,830 or $2,530. Still, the broader structure supports recovery within the post-2025 consolidation phase.
Treasury Data Shows Institutional Shift Toward ETH
Moreover, according to another analyst, CryptoRand, institutional behavior is increasingly favoring ETH over peers. Treasury allocation data shows ETH’s share of total supply held by digital asset treasuries rising from 2.5% to 3.4% in 2025. This move surpasses Bitcoin’s treasury share.

More so, the trend reflects structural demand driven by staking yields and ecosystem growth. BitMine now controls roughly 3.4% of ETH supply after aggressive accumulation. This slightly exceeds Strategy’s Bitcoin holdings by percentage. Morgan Stanley’s spot Ethereum ETF filing further supports institutional adoption.
Furthermore, reduced circulating supply strengthens long-term price dynamics. As more ETH is locked for yield, available liquidity tightens. Network activity reaching all-time highs reinforces this thesis. If this trajectory extends into 2026, Ethereum price could benefit from sustained supply-side pressure.
The post Ethereum Price Prediction: Bulls Target $3,700 on Triangle Breakout appeared first on CoinCentral.


You May Also Like

USD/JPY Intervention Alert: Critical 160 Level Raises Stakes for Bank of Japan

The web2 casino playbook is broken: Here’s what’s replacing it.