Injective Network Usage Jumps to 87K Users as INJ Bulls Target $7 Resistance
Injective has shared a big on-chain achievement, as the number of actively participating users on the network reached an all-time high in January. It has been found that the average number of active daily users on the blockchain stood at 87,000 in January.
This increase in usage is indicative of the adoption that Injective’s ecosystem is gaining, especially in the areas of decentralized trading, derivatives, and DeFi applications on its network. This steady increase in usage is also a sign that more and more users are opting for Injective’s high-speed transactions, low fees, and dedicated financial infrastructure solutions, making Injective one of the premier Layer-1 blockchains out there.
Also Read: Injective (INJ) Price Analysis Suggests Potential Target Around $6
INJ Breaks Long-Term Downtrend, Bulls Eye $7 Target
However, the crypto analyst highlighted that Injective (INJ) is also showing some strong momentum, as it has successfully broken out of its long-term downtrend and is also holding well on its retest for a major psychological level at $5.00. This is a sign that the Injective coin’s market structure has once again turned favorable on the charts, indicating that it is getting back under the control of the bulls. Currently, INJ is trading around $5.09. This price is sitting just below an important liquidation level, which could trigger bigger price swings.
Source: X
Data is still supporting the bulls. The short interest is ranged between $5.80, $6.50, and up to $7.20. An obvious target is formed. The funding rates are neutral with a compressed open interest value near $3.34 million, and often a precursor to a volatility explosion. The range is between $4.85 and $5.00, where bulls are in control, with a break above $5.44 leading to a target of $7.00+ or a close below $4.35.
Injective (INJ) Weekly Chart Suggest Bearish Pressure
The INJ is in a clear long-term downtrend on the weekly chart, with price resting in the region of $5.30 after being unable to reclaim past support levels. Lack of good follow-through on past bullish action suggests sellers are still in control of the overall trend. The INJ is currently resting on a demand area, but there has been no identifiable reversal pattern yet.
Source: TradingView
The momentum indicators are generally bearish. The RSI indicator is hovering in the vicinity of 35, suggesting a weak momentum and a close to oversold level without a strong countertrend bounce. The MACD indicator is below the zero level with a series of bars with a negative value, suggesting bear pressure.
Also Read: Injective Holds Support at $4.41: Could INJ Rebound Toward $29?


You May Also Like
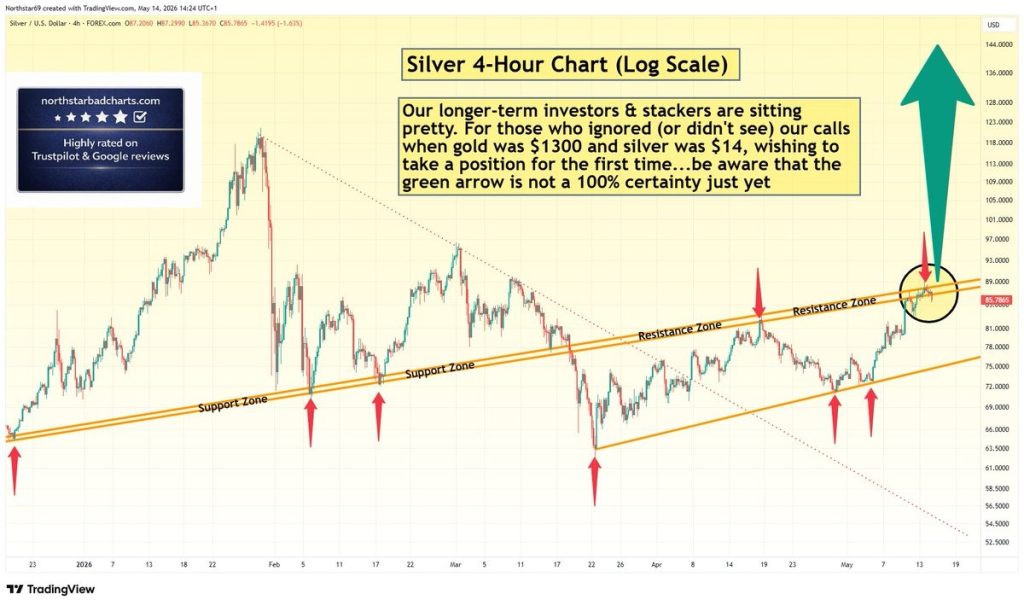
Silver Price Warning: Green Arrow Setup Is Not Confirmed – Wait for Clear Signal

Facebook spotlights African cinema in 6th ‘Made by Africa, loved by the world’ campaign