The post Chainlink Price Nears Breakout, But Why Are LINK Whales Selling? appeared first on Coinpedia Fintech News The Chainlink price has remained stuck withinThe post Chainlink Price Nears Breakout, But Why Are LINK Whales Selling? appeared first on Coinpedia Fintech News The Chainlink price has remained stuck within

Chainlink Price Nears Breakout, But Why Are LINK Whales Selling?

2026/01/10 19:52
3 min read
For feedback or concerns regarding this content, please contact us at crypto.news@mexc.com
Chainlink Whales Are Loading Up Quietly, Is LINK Heading to $46?

The post Chainlink Price Nears Breakout, But Why Are LINK Whales Selling? appeared first on Coinpedia Fintech News

The Chainlink price has remained stuck within a close range following its rejection from the 2025 highs above $26. Currently, the popular DeFi token is approaching a critical turning point that may define the next price action. The price is compressing inside a long-term structure that has been developing for years, suggesting a large move may be building. Despite this, the whales are seen offloading LINK, which could be a matter of concern for the traders as well as the Chainlink price rally. 

INK Price Compresses Inside a Long-Term Structure

On the weekly chart, LINK continues to trade inside a broad ascending structure, defined by a rising support trendline and a descending resistance line stretching back to the 2021 peak. This type of multi-year compression often precedes a high-volatility breakout.

link price

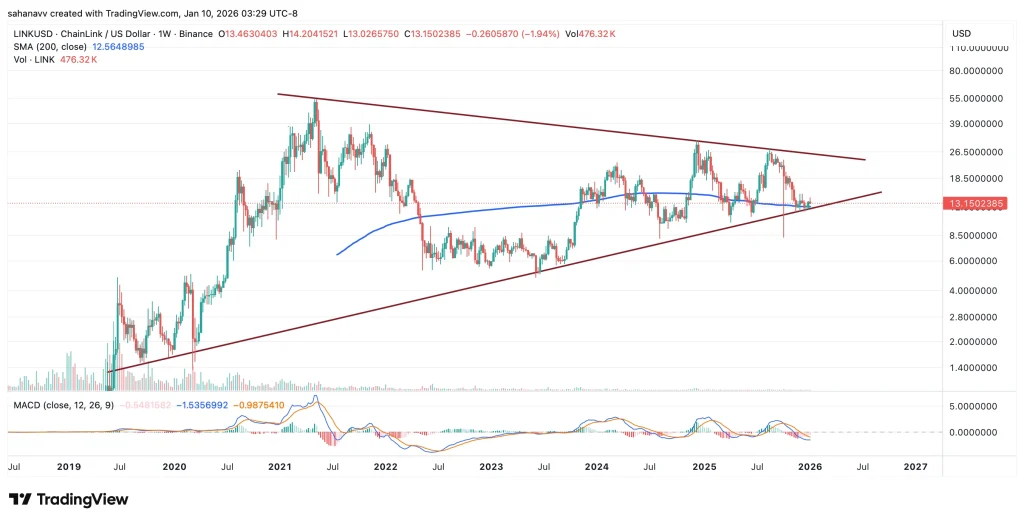
Price is currently hovering near the 200-week moving average, a level that has acted as both resistance and support during previous cycle transitions. As long as LINK holds above the $12–$13 zone, the structure remains intact.

A confirmed breakout above the descending resistance, currently aligned near the $18–$20 range, could open the door for a measured move toward $24–$26 first. That would represent a rally of roughly 70–80% from current levels. Failure to hold the lower trendline, however, would invalidate the bullish setup and push LINK back into range-bound conditions.

Whales Are Selling—But Context Matters

On-chain data shared by Ali shows that whales have sold over 2 million LINK in the past seven days. Whale-held balances dipped before stabilising, suggesting distribution rather than aggressive dumping.

For traders, this is not automatically bearish. Historically, whale selling near compression zones can mean profit-taking ahead of volatility, redistribution to smaller holders and liquidity preparation before a breakout.

If whales were exiting entirely, the price would likely break below the structure. So far, that hasn’t happened. LINK continues to respect key support levels despite the selling pressure.

This divergence between stable price structure and declining whale holdings is worth watching closely.

Chainlink (LINK) price is no longer drifting—it is coiling inside a long-term structure. The weekly chart continues to hold, keeping the case for a breakout alive. If resistance gives way, LINK could unlock a 70–80% upside move from current levels.

However, whale selling adds a layer of risk. While it has not broken the price structure yet, it means traders should rely on confirmation, not anticipation.

What to watch next:

  • Bullish continuation: LINK holds above $12–$13 and breaks through $18–$20 with strong volume. That would signal trend expansion.
  • Bearish invalidation: A weekly close below the rising support or the 200-week average would likely send LINK back into a prolonged range.
  • On-chain confirmation: Whale selling slows or stabilizes as price pushes higher.
Market Opportunity
Chainlink Logo
Chainlink Price(LINK)
$8.72
$8.72$8.72
+1.83%
USD
Chainlink (LINK) Live Price Chart
Disclaimer: The articles reposted on this site are sourced from public platforms and are provided for informational purposes only. They do not necessarily reflect the views of MEXC. All rights remain with the original authors. If you believe any content infringes on third-party rights, please contact crypto.news@mexc.com for removal. MEXC makes no guarantees regarding the accuracy, completeness, or timeliness of the content and is not responsible for any actions taken based on the information provided. The content does not constitute financial, legal, or other professional advice, nor should it be considered a recommendation or endorsement by MEXC.

You May Also Like

Today’s Biggest Crypto Movers: Dogecoin Leads the Pack

Today’s Biggest Crypto Movers: Dogecoin Leads the Pack

Today's Biggest Crypto Movers: Dogecoin Leads the Pack 🚀 Crypto Markets Heat Up Today Major cryptocurrencies are showing strong gains. Let's dive into today's top
Share
Blockchainmagazine2026/04/03 13:00
RWA Boom Accelerates As Tokenized Assets Hit New Highs In Early 2026

RWA Boom Accelerates As Tokenized Assets Hit New Highs In Early 2026

RWA distributed value rose from about $21B to $27.5B in Q1 2026, a gain of roughly 30%. Tokenized US Treasuries reached about $10B, creating an on-chain yield base
Share
LiveBitcoinNews2026/04/03 13:00
Cryptos Signal Divergence Ahead of Fed Rate Decision

Cryptos Signal Divergence Ahead of Fed Rate Decision

The post Cryptos Signal Divergence Ahead of Fed Rate Decision appeared on BitcoinEthereumNews.com. Crypto assets send conflicting signals ahead of the Federal Reserve’s September rate decision. On-chain data reveals a clear decrease in Bitcoin and Ethereum flowing into centralized exchanges, but a sharp increase in altcoin inflows. The findings come from a Tuesday report by CryptoQuant, an on-chain data platform. The firm’s data shows a stark divergence in coin volume, which has been observed in movements onto centralized exchanges over the past few weeks. Bitcoin and Ethereum Inflows Drop to Multi-Month Lows Sponsored Sponsored Bitcoin has seen a dramatic drop in exchange inflows, with the 7-day moving average plummeting to 25,000 BTC, its lowest level in over a year. The average deposit per transaction has fallen to 0.57 BTC as of September. This suggests that smaller retail investors, rather than large-scale whales, are responsible for the recent cash-outs. Ethereum is showing a similar trend, with its daily exchange inflows decreasing to a two-month low. CryptoQuant reported that the 7-day moving average for ETH deposits on exchanges is around 783,000 ETH, the lowest in two months. Other Altcoins See Renewed Selling Pressure In contrast, other altcoin deposit activity on exchanges has surged. The number of altcoin deposit transactions on centralized exchanges was quite steady in May and June of this year, maintaining a 7-day moving average of about 20,000 to 30,000. Recently, however, that figure has jumped to 55,000 transactions. Altcoins: Exchange Inflow Transaction Count. Source: CryptoQuant CryptoQuant projects that altcoins, given their increased inflow activity, could face relatively higher selling pressure compared to BTC and ETH. Meanwhile, the balance of stablecoins on exchanges—a key indicator of potential buying pressure—has increased significantly. The report notes that the exchange USDT balance, around $273 million in April, grew to $379 million by August 31, marking a new yearly high. CryptoQuant interprets this surge as a reflection of…
Share
BitcoinEthereumNews2025/09/18 01:01

Trade GOLD, Share 1,000,000 USDT

Trade GOLD, Share 1,000,000 USDTTrade GOLD, Share 1,000,000 USDT

0 fees, up to 1,000x leverage, deep liquidity