Volatility is freezing on the Dogecoin price, but that rarely lasts long

In a fearful, risk-off crypto market, the Dogecoin price is hovering near key technical levels that signal compressed volatility and a potential for sharper moves ahead.
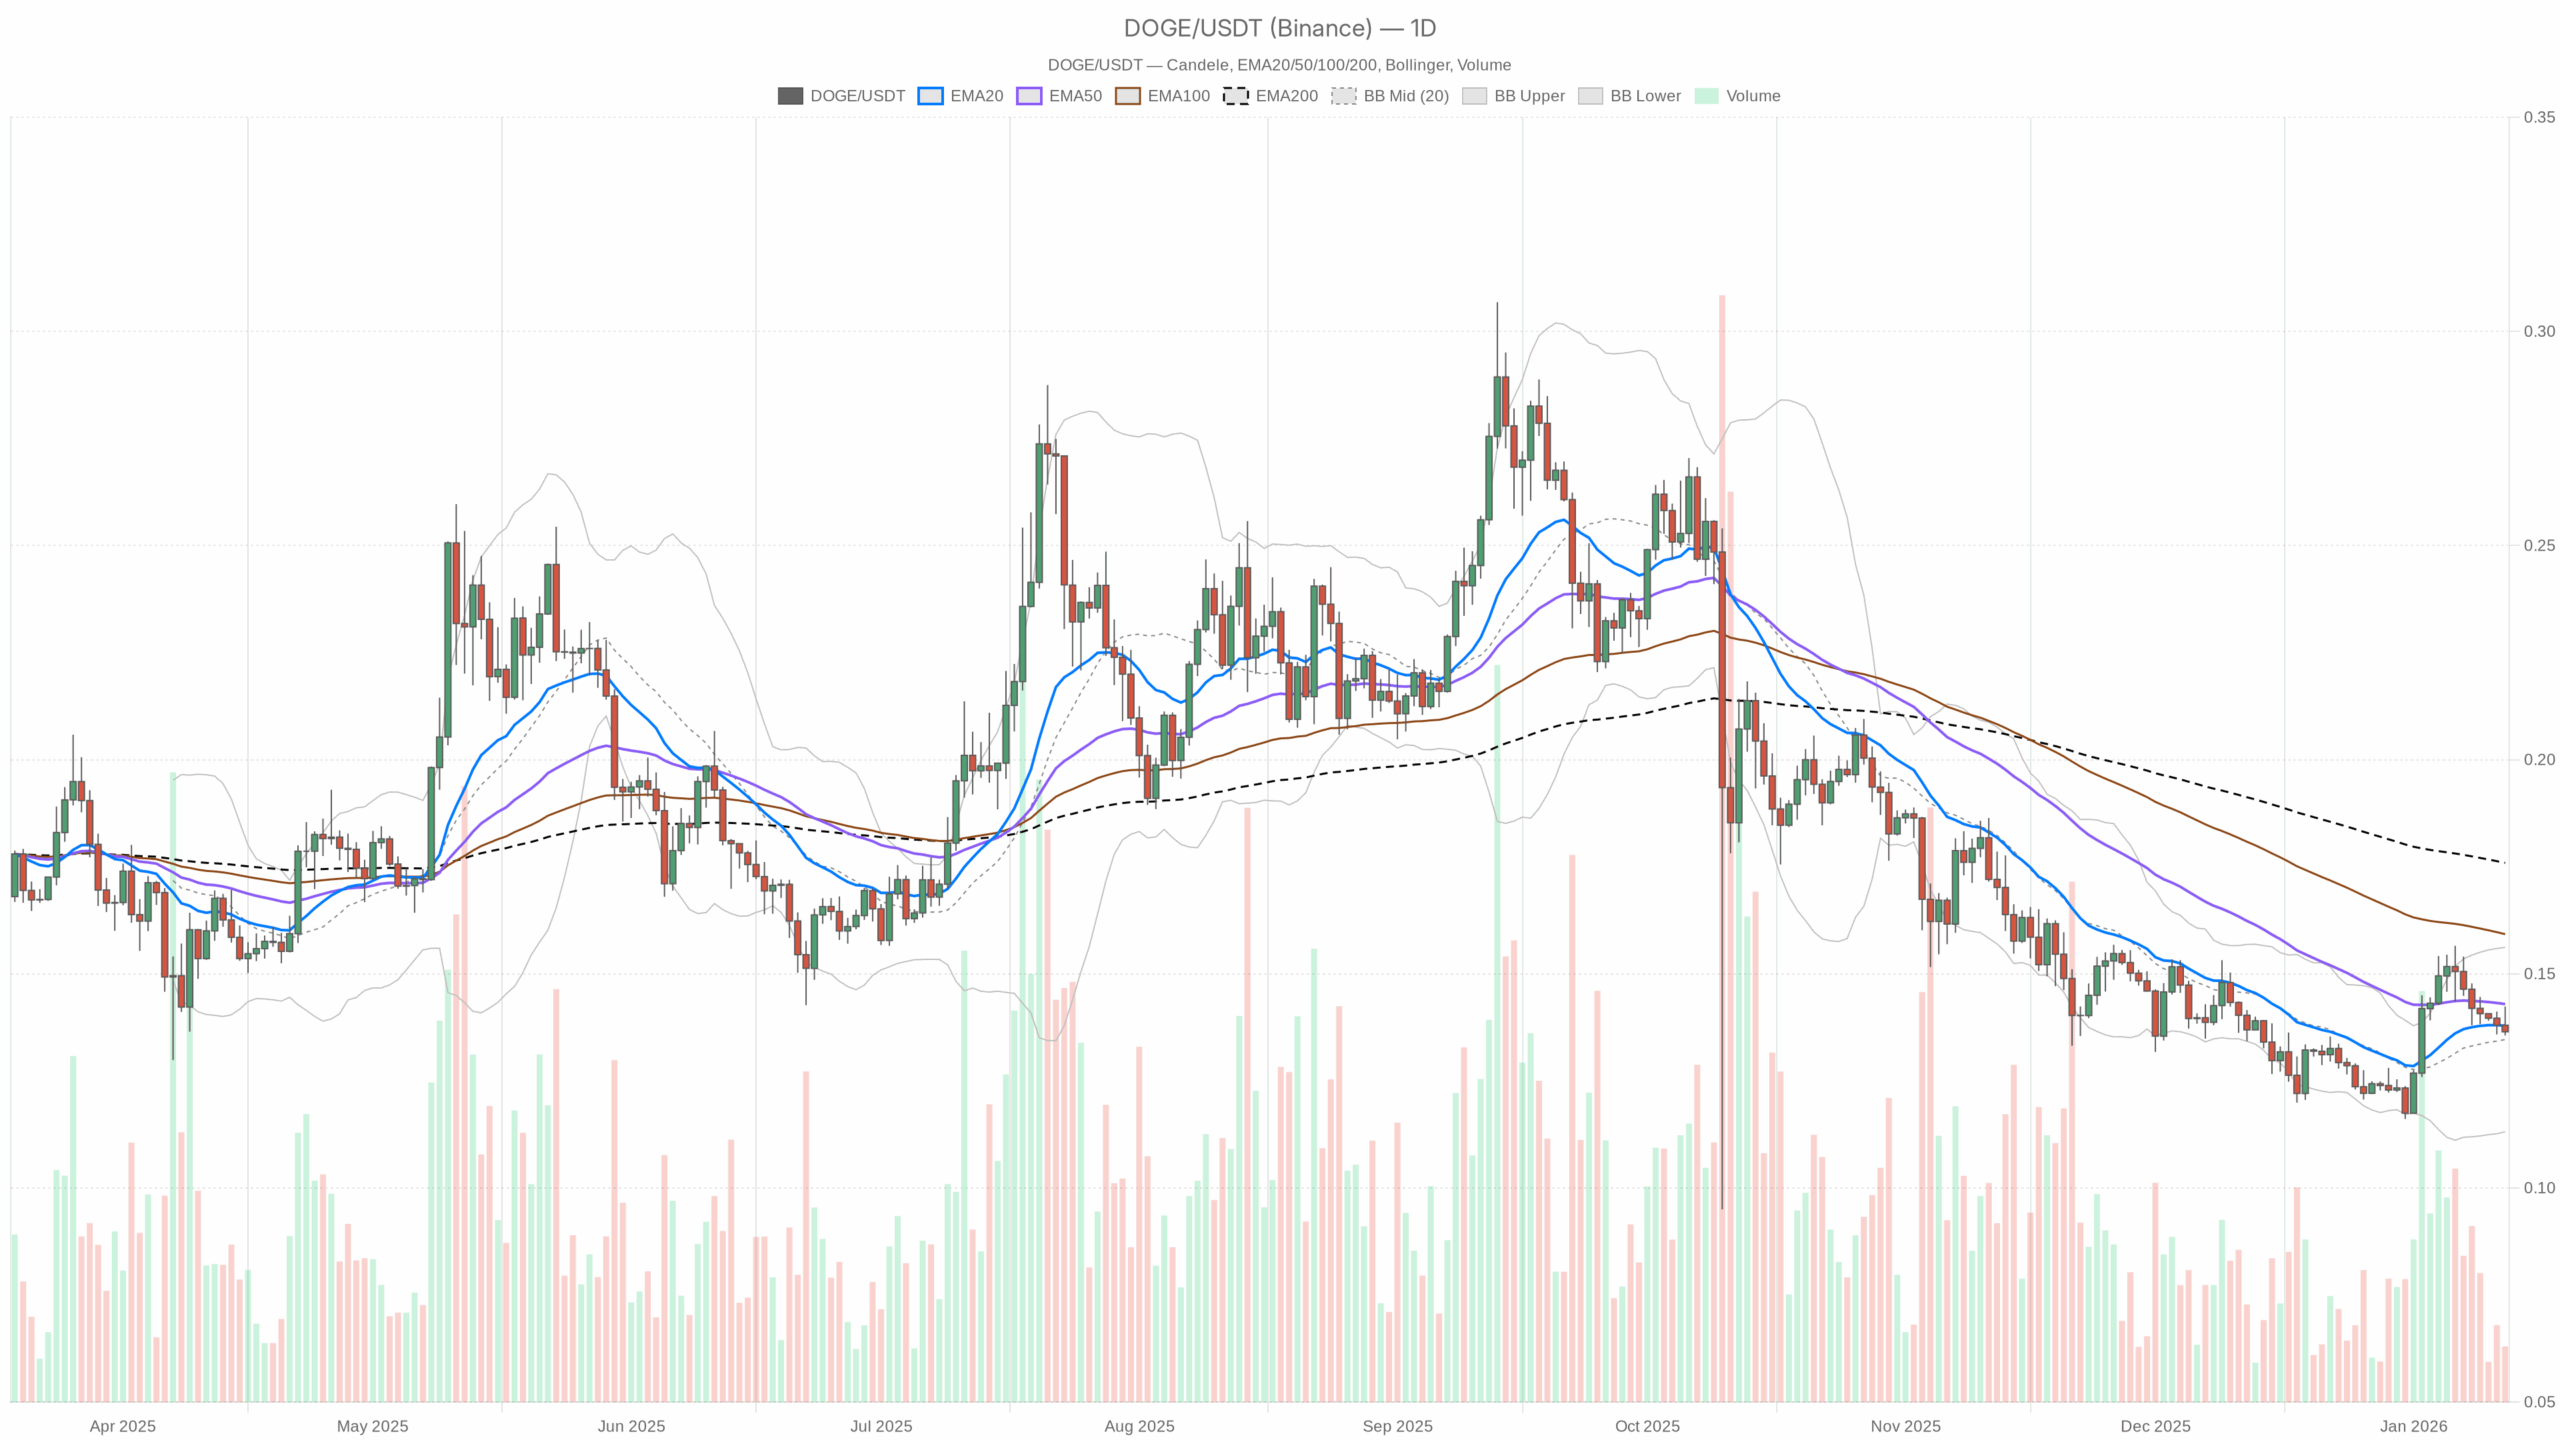 DOGE/USDT — daily chart with candlesticks, EMA20/EMA50 and volume.
Main scenario on the daily chart (D1): structurally bearish, tactically neutral
On the daily timeframe, the bias is still bearish, but in a very specific sense: structure is bearish, momentum is neutral. That combination often precedes either a mean-reversion bounce into resistance or a sharp flush once liquidity returns.
Trend structure – EMAs
– Price (close D1): $0.14
– EMA 20: $0.14
– EMA 50: $0.14
– EMA 200: $0.18
– Regime flag: bearish
The 20-day and 50-day EMAs are essentially flat and overlapping right on the current Dogecoin price around $0.14, while the 200-day EMA is higher at $0.18. That tells you two things:
- The long-term trend is still down (price below the 200-day).
- The short- to mid-term trend has stalled (short EMAs flat and bunched up).
In plain English, the downtrend has lost momentum but has not reversed. It is more like Dogecoin is resting under a ceiling than starting a fresh uptrend.
Momentum – RSI & MACD
– RSI 14 (D1): 48.45
– MACD line / signal / histogram (D1): all effectively at 0
Daily RSI just under 50 is pure indecision. There is no real buying pressure, but also no active capitulation. Dogecoin is not overbought, it is not oversold, it is effectively being ignored.
MACD being pinned around zero confirms the same story: no strong bullish or bearish momentum on the daily. The previous trend has run its course, but a new directional leg has not started. This is the kind of backdrop where news, liquidity shocks, or broader market moves can punch price out of equilibrium quickly.
Volatility and ranges – Bollinger Bands & ATR
– Bollinger Bands (D1): mid $0.13, upper $0.16, lower $0.11
– ATR 14 (D1): $0.01
On the daily chart, price is sitting close to the middle of the Bollinger Bands. The band spread ($0.11–0.16) outlines the current medium-term value area. We are nowhere near the extremes, so there is no immediate squeeze breakout or band-walk trend in play yet.
ATR around $0.01 on a $0.14 asset is low but not abnormal for a cooling phase. The key reading here is simple: volatility has compressed compared to the prior swings. Historically for DOGE, low volatility rarely persists and it tends to resolve with sharp moves once traders wake up again.
Daily pivot levels
– Pivot Point (PP, D1): $0.14
– R1 (D1): $0.14
– S1 (D1): $0.13
The daily pivots clustering right around the current price show we are hanging at a short-term balance point. S1 down at $0.13 is the first line where dip buyers might react. On the upside, there is no clearly defined immediate pivot resistance above, so the market will likely look to the $0.16 band top and then the $0.18 200-day EMA as the next real tests.
Macro context and dominance backdrop
The dominant force right now is macro risk-off and altcoin neglect. Bitcoin is holding over 56% market dominance, the total crypto market cap is flat to slightly negative, and the Fear & Greed Index is sitting in the Fear zone at 27. In that context, Dogecoin at $0.14 and under its 200-day average is a textbook laggard. It is not being aggressively sold, but it is not being bid either, so it remains in the waiting room.
Intraday picture: intraday selling pressure, but frozen tape
1-hour (H1): weak intraday bid, frozen volatility
– Price (close H1): $0.14
– EMA 20 / 50 / 200 (H1): all around $0.14
– RSI 14 (H1): 37.95
– MACD (H1): around 0
– Bollinger Bands (H1): squeezed tightly around $0.14
– ATR 14 (H1): 0
– Pivots (H1): PP / R1 / S1 all clustered at $0.14
The hourly chart looks almost artificial, with price stuck at $0.14, ATR effectively at zero, Bollinger Bands collapsed on top of price, and all EMAs overlapping. That is a classic micro-liquidity freeze. There is very little two-way trade, spreads are likely tight but with low depth, and nobody is pushing the tape.
RSI down around 38 tells you that, beneath the still surface, the pressure has leaned slightly to the sell side on this timeframe. It is not a crash, just a gentle grind that has now run into inactivity. With MACD flat, there is no real momentum structure to lean on intraday, only the knowledge that when volatility comes back, the first directional push can extend before mean-reverting.
15-minute (M15): very short term stretched to the downside
– Price (close M15): $0.14
– EMA 20 / 50 / 200 (M15): all near $0.14
– RSI 14 (M15): 28.9
– MACD (M15): around 0
– Bollinger Bands & ATR (M15): extremely tight, ATR at 0
– Regime (M15): bearish
The 15-minute RSI below 30 flags a locally oversold condition, even though price itself barely moved in absolute terms. What this really means is that in the tiny moves that did occur, selling dominated, but volatility is so compressed that the market has not been allowed to express a proper reaction yet.
For execution, this is a reminder: shorting into a low-volatility, locally oversold intraday tape carries poor reward/risk unless a fresh catalyst hits. Any small positive surprise can trigger a quick snap-back on this timeframe, even while the broader daily trend remains fragile.
Dogecoin price scenarios
Bullish scenario: mean reversion into resistance
The constructive path from here is not immediate moon, but a mean-reversion bounce from a depressed, low-liquidity environment.
What the bullish path looks like:
- Dogecoin holds above $0.13 on a daily closing basis, keeping the current range intact.
- RSI on D1 pushes decisively back above 50–55, marking a shift from apathy to active buying.
- Price starts to climb toward the $0.16 upper Bollinger Band, ideally with expanding ATR, meaning volatility comes back on an up-move, not a dump.
- On the way up, the short EMAs (20/50) start to tilt upward and separate from each other, turning the flat cluster into a short-term rising structure.
In that case, key upside checkpoints are:
- $0.16: first major resistance in line with the daily band top.
- $0.18: the 200-day EMA and a critical trend inflection zone. Reclaiming and holding above this level would be the first serious signal that the larger downtrend is ending and a new medium-term uptrend is in play.
What would invalidate the bullish scenario?
A clean daily close below $0.13, especially if accompanied by a drop in RSI toward the low 40s or below and an expansion in ATR to the downside, would tell us buyers have failed to defend the current range. That would move the focus from mean reversion to continuation of the broader bearish structure.
Bearish scenario: range breaks and trend resumes
The bearish side respects the current macro setup: fearful sentiment, Bitcoin dominance high, and altcoins largely sidelined. In this environment, Dogecoin is vulnerable if liquidity leaves alts again or if BTC rolls over.
What the bearish path looks like:
- Dogecoin loses $0.13 support on volume, turning the current floor into resistance.
- Daily RSI sinks into the low 40s or 30s, confirming a shift from neutrality to sustained selling.
- ATR expands as the range finally breaks, but this time the expansion comes on a downward move.
- EMAs on D1 start to fan downward again, with the 20-day rolling below the 50-day in a more pronounced fashion.
In that scenario, the market will search for a lower value area, likely somewhere closer to the $0.11 lower Bollinger Band as an initial magnet. If fear in the broader market deepens, a quick stab through those band lows would not be surprising before a more meaningful bounce.
What would invalidate the bearish scenario?
A strong push back above $0.16 with rising volume and daily RSI reclaiming and holding above 55 would argue that the downside break was a bear trap. From there, any sustained trade above the 200-day EMA at $0.18 would effectively kill the dominant bearish structure and force bears to reassess.
How to think about positioning around the current Dogecoin price
Right now, Dogecoin is in a low-volatility, low-conviction pocket. The daily trend is still technically bearish, with price under the 200-day, but the lack of momentum and the compressed ranges mean you are being paid very little for aggressive directional bets until volatility returns.
For bulls, the tape does not yet justify heavy exposure. The higher-probability play is usually to wait for confirmation, such as a break toward $0.16 with rising volume and an uptick in daily RSI and ATR. Buying deep into a frozen, fearful market before that happens means you are betting on timing, not structure.
For bears, the risk is almost the mirror image. Shorting a coin that is already under its 200-day, with intraday RSI oversold and volatility dead, is often late in the move. The macro context favors caution on meme assets, but the immediate reward/risk is not compelling unless Dogecoin clearly loses $0.13 with energy behind the break.
Volatility, by definition, will return. The key is not to confuse a quiet market with a safe one. When ranges compress this hard, the next leg tends to be sharp, and being wrong on direction can hurt quickly. Sizing, stops, and time horizon matter more than usual in this type of regime.
If you want to monitor markets with professional charting tools and real-time data, you can open an account on Investing using our partner link:
Open your Investing.com account
This section contains a sponsored affiliate link. We may earn a commission at no additional cost to you.
This article is a market commentary and reflects a technical view on the Dogecoin price based on the data available at the time of writing. It is not investment advice, and it does not take into account your individual circumstances, risk tolerance, or financial objectives. Cryptoassets are highly volatile and can move sharply in either direction; never risk capital you cannot afford to lose.


You May Also Like

SC upholds ruling vs P17-billion telco SMS refund order

PMI-ACP Exam Preparation: How to Use a Simulator and Practice Questions Effectively