Lighter price slid sharply after breaking a key support level below, extending its post-launch sell-off and keeping short-term pressure firmly in place. At pressLighter price slid sharply after breaking a key support level below, extending its post-launch sell-off and keeping short-term pressure firmly in place. At press

Lighter price drops 20% as breakdown below $2.30 confirms trend reversal

Lighter price slid sharply after breaking a key support level below, extending its post-launch sell-off and keeping short-term pressure firmly in place.

Summary
  • Lighter extended its sell-off after a clear technical breakdown
  • Market participation is skewed toward short-term traders rather than long-term holders.
  • Momentum indicators are weak, with RSI hovering in oversold territory.

At press time, LIT was trading at $2.07, down 20% over the past 24 hours. The token has fallen 31% over the past week and is now roughly 73% below its $7.86 all-time high set shortly after launch on Dec. 30. Over the past seven days, prices have ranged between $2.07 and $3.21.

Spot market activity has slowed alongside the drop. Trading volume declined 64% to $15 million, pointing to reduced demand as the price slipped below its former support.

Derivatives tell a more active story. According to CoinGlass data, perpetual trading volume jumped nearly 118% to $21 million, while open interest climbed 47% to $1.69 million.

The increases suggest that most positioning is focused on short-term momentum rather than taking on longer-term exposure.

Buybacks fail to boost price

Lighter is a perpetual DEX based on Ethereum that offers on-chain execution and zero-fee trading. After raising $68 million in a round headed by Founders Fund and Ribbit Capital, which valued the business at $1.5 billion, the project unveiled its LIT token in late 2025.

In early January, LIT saw a brief push higher, climbing toward $2.89 after Lighter launched a treasury buyback program that directs 50% of protocol fees toward repurchasing tokens. 

A brief rebound after the announcement was mostly fueled by whale wallet activity. The momentum quickly faded as early holders sold and sector-wide rotation started to affect the price. 

Lighter has expanded its product line to include tokenized stock offerings like MSTR and CRCL, as well as multi-signature wallet support. These updates strengthen the platform’s longer-term foundation, but so far they haven’t translated into a change in near-term sentiment.

Lighter price technical analysis

Lighter’s 1-hour chart reflects a clear bearish structure. Price has posted lower highs and lower lows since failing near the $3.10–$3.20 zone. Each rebound attempt has stalled sooner than the last, keeping sellers in control.

Lighter price drops 20% as breakdown below $2.30 confirms trend reversal - 1

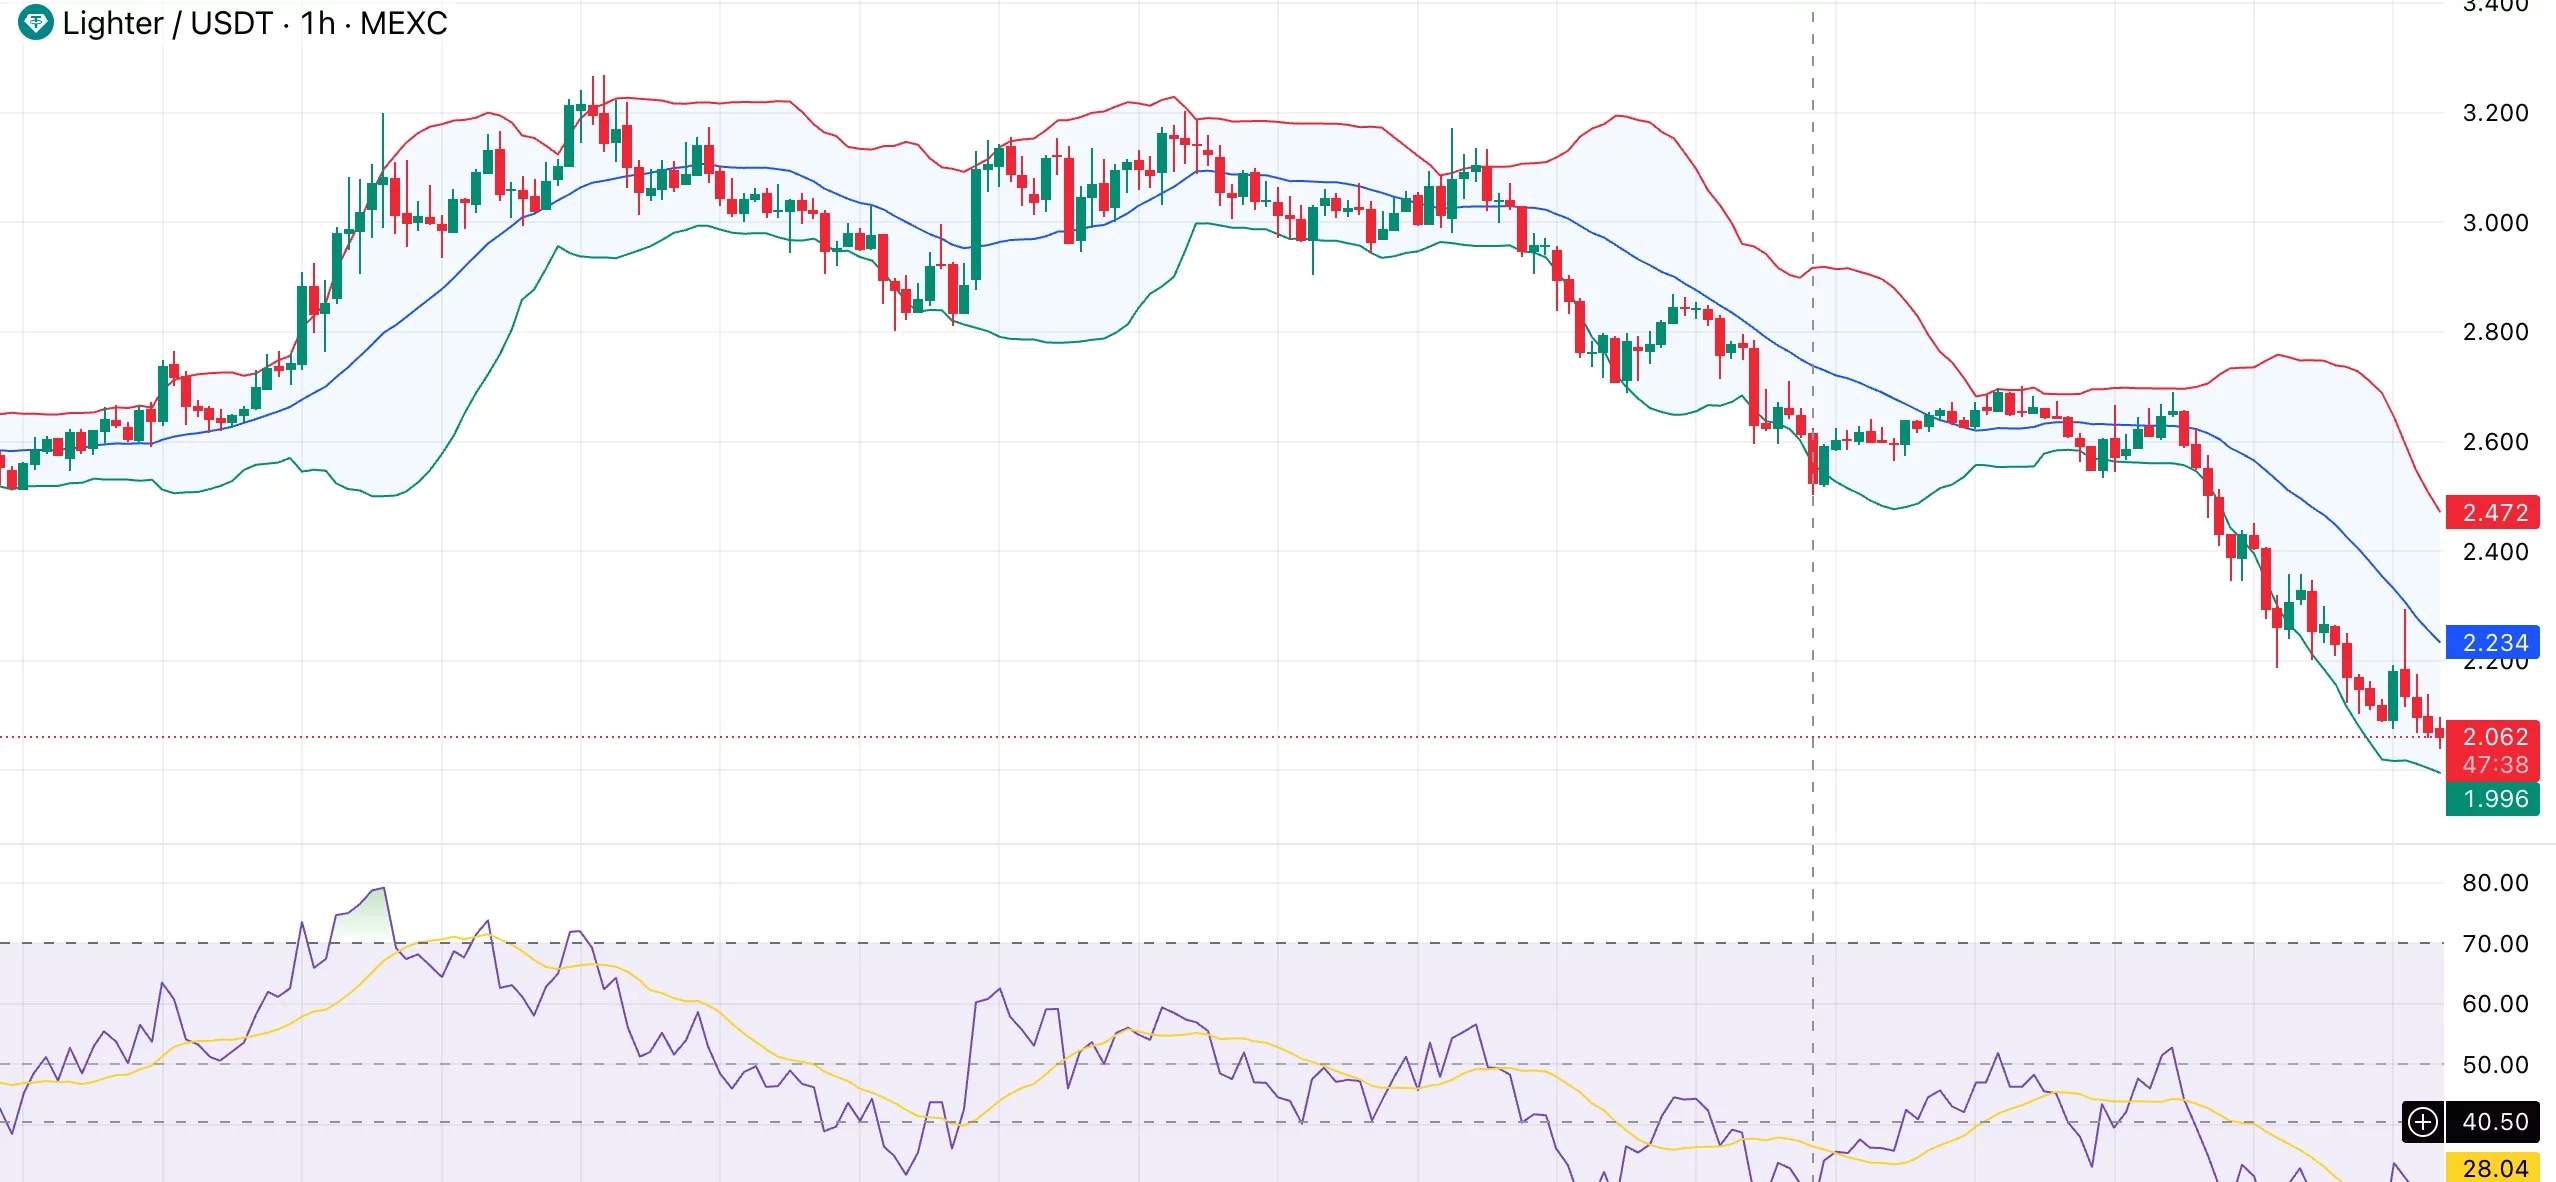
LIT is trading below the 50-period moving average near $2.23, which has turned into dynamic resistance and continues to slope downward. There has been little interest in dip-buying as attempts to regain this level have failed. 

Instead of tightening, Bollinger Bands are expanding. Price is closing in on the lower band, indicating that the downward momentum is still strong rather than exhausted. 

Momentum indicators echo this weakness. The 14-period relative strength index sits near 28, deep in oversold territory. While this increases the odds of a short-term bounce, RSI has struggled to reclaim the 40–45 zone, showing that bearish pressure still dominates.

The $2.30–$2.35 area, which previously acted as a base, has broken cleanly. Price is now leaning on support around $2.00–$2.05, where the lower Bollinger Band and horizontal demand align. A break below $2.00 would expose the token to further downside.

Market Opportunity
Lighter Logo
Lighter Price(LIT)
$2.222
$2.222$2.222
-3.72%
USD
Lighter (LIT) Live Price Chart
Disclaimer: The articles reposted on this site are sourced from public platforms and are provided for informational purposes only. They do not necessarily reflect the views of MEXC. All rights remain with the original authors. If you believe any content infringes on third-party rights, please contact service@support.mexc.com for removal. MEXC makes no guarantees regarding the accuracy, completeness, or timeliness of the content and is not responsible for any actions taken based on the information provided. The content does not constitute financial, legal, or other professional advice, nor should it be considered a recommendation or endorsement by MEXC.

You May Also Like

Verizon (VZ) Stock; Drops 2% as FCC Revises 60-Day Unlock Rule

Verizon (VZ) Stock; Drops 2% as FCC Revises 60-Day Unlock Rule

TLDRs; Verizon shares dropped 2% after the FCC ended the 60-day automatic unlock rule for postpaid phones. The policy change comes after nearly 785,000 Verizon
Share
Coincentral2026/01/13 16:43
US Senate Banking crypto bill draft lands in Washington

US Senate Banking crypto bill draft lands in Washington

The post US Senate Banking crypto bill draft lands in Washington appeared on BitcoinEthereumNews.com. A draft of the digital asset bill circulated in Washington
Share
BitcoinEthereumNews2026/01/13 16:13
Litecoin Fluctuates Below The $116 Threshold

Litecoin Fluctuates Below The $116 Threshold

The post Litecoin Fluctuates Below The $116 Threshold appeared on BitcoinEthereumNews.com. Sep 17, 2025 at 23:05 // Price Litecoin price analysis by Coinidol.com: LTC price has slipped below the moving average lines after hitting resistance at $120. Litecoin price long-term prediction: bearish The 21-day SMA support helped to alleviate the selling pressure. In other words, the price of the cryptocurrency is above the 21-day SMA support but below the 50-day SMA barrier. This suggests that Litecoin will be trapped in a narrow range for a few days. If the 21-day SMA support or the 50-day SMA barrier is overreached, the cryptocurrency will trend upwards. For example, if the LTC price breaks through the 50-day SMA barrier, it will rise to a high of $124. Litecoin will fall to its current support level of $106 if the 21-day SMA support is broken. Technical Indicators  Resistance Levels: $100, $120, $140 Support Levels: $60, $40, $20 LTC price indicators analysis Litecoin’s price is squeezed between the moving average lines. It is unclear in which direction Litecoin will move. The moving average lines are horizontal in both charts. However, the price bars are limited to the distance between the moving averages. The price bars on the 4-hour chart are below the moving average lines. LTC/USD price chart – September 17, 2025 What is the next move for LTC? On the 4-hour chart, Litecoin is currently trading in a bearish trend zone. The altcoin is trading above the $112 support and below the moving average lines, which represent resistance at $116. The upward movement is hindered by the moving average lines, which are causing the price to oscillate within a limited range. Meanwhile, the signal for the cryptocurrency is bearish, with price bars below the moving average…
Share
BitcoinEthereumNews2025/09/18 08:15