

Ethereum price holds above $3,300 as bulls press into resistance – trend still constructive but stretched

Against a strong risk-on backdrop, Ethereum price is pushing into local resistance while broader crypto flows remain heavily Bitcoin-led.
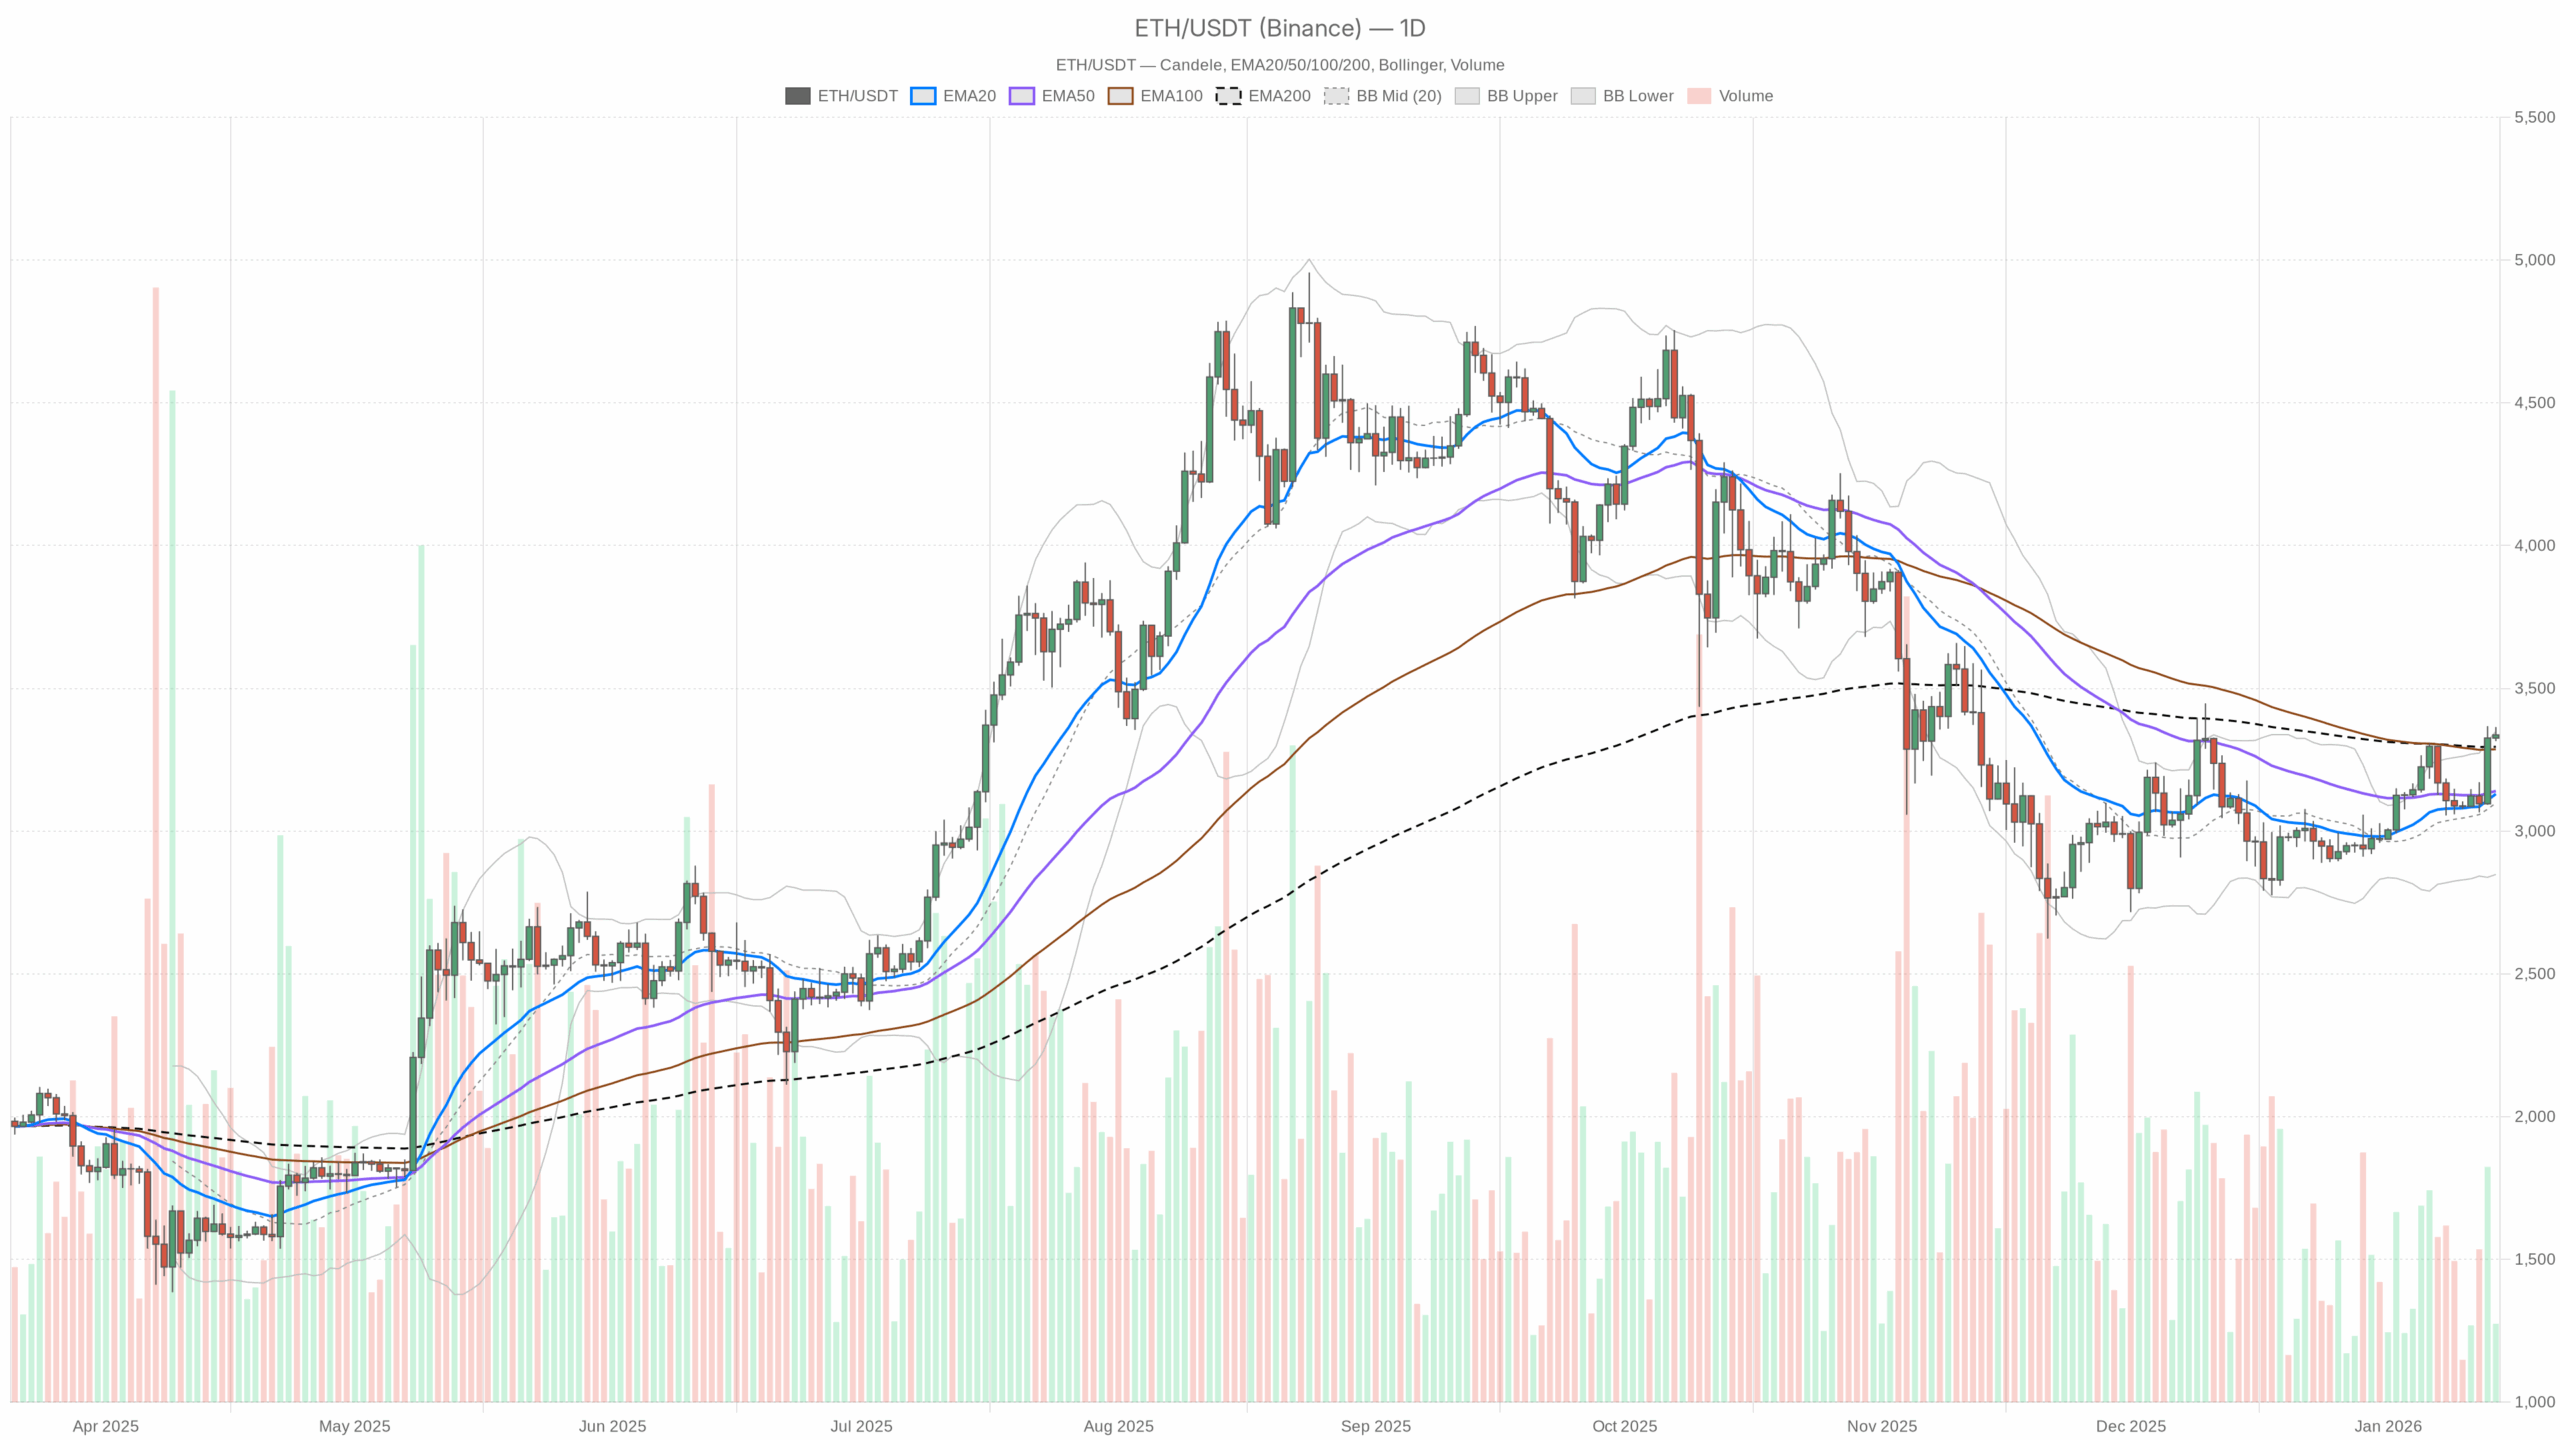 ETH/USDT daily chart with EMA20, EMA50 and volume”
loading=”lazy” />ETH/USDT — daily chart with candlesticks, EMA20/EMA50 and volume.
Daily bias: bullish, but close to a decision zone
On the daily (D1), Ethereum price sits at $3,336.88, clearly above all the key moving averages. The regime flag is technically neutral, but the price action is anything but flat: we are trading above the 20, 50, and 200-day EMAs and hugging the upper volatility band. This is an advancing market bumping into resistance rather than a market at equilibrium.
EMAs (trend structure)
– EMA 20: $3,130.03
– EMA 50: $3,140.48
– EMA 200: $3,295.46
Price at $3,336 is comfortably above all three, with the 20 and 50-day almost on top of each other and just under the 200-day. The short- and medium-term trend are aligned, and price is also back above the longer-term trend line (EMA 200). That combination usually means trend traders will defend pullbacks toward $3,150–3,250 on first touch, because the path of least resistance is still up.
RSI (momentum and risk of overheating)
– RSI 14 (daily): 65.35
Daily RSI is in bullish territory but not yet extreme. Momentum is firmly on the bulls’ side, but we are close enough to the typical overbought band that another impulsive push could trigger profit-taking. Practically, this means the market can still extend higher, but late longs need a clear invalidation level because the easy money from the swing is probably behind us.
MACD (trend strength)
– MACD line: 54.03
– Signal: 31.11
– Histogram: 22.91 (positive)
MACD is solidly bullish: the line is well above the signal and the histogram is positive and wide. Trend-followers are still in control on the daily; there is no clean topping signal yet. It confirms that the current up-move is more than just a quick squeeze, and the trend has some depth behind it.
Bollinger Bands (position within the range)
– Middle band: $3,098.34
– Upper band: $3,348.52
– Lower band: $2,848.17
– Price: $3,336.88 (right below the upper band)
Ethereum price is pressing into the upper band, which is classic trend behavior in an advance, but it also means we are in the expensive half of the volatility envelope. In strong trends, price can walk the band for days; however, when combined with a near-70 RSI, this is usually not where professionals initiate fresh swing longs. It is where they trail stops tighter and start thinking about mean reversion risk.
ATR (volatility backdrop)
– ATR 14 (daily): $105.20
Daily ATR a bit above $100 means Ethereum price is routinely swinging 3% or more in a day. Volatility is elevated but not chaotic. From a positioning perspective, stops need more breathing room; using tiny stops around 1–2% will get you chopped out very easily in this environment.
Daily pivot levels (nearby inflection zones)
– Pivot point (PP): $3,338.89
– R1: $3,362.63
– S1: $3,313.14
Price is trading almost exactly at the daily pivot, with a very tight band up to R1 and down to S1. We are sitting at an intraday equilibrium on the daily map. A decisive break and hold above $3,362–3,370 would frame today as a bullish expansion day, while sustained trading below $3,313 would raise the odds of a deeper fade toward the 20-day EMA.
Hourly chart: trend up, but momentum is stretched
The 1H chart is outright bullish and, unlike the daily, the system regime here is explicitly flagged bullish. Price is grinding higher above all key moving averages, but hourly momentum is starting to look tired.
EMAs on H1
– EMA 20: $3,277.88
– EMA 50: $3,208.95
– EMA 200: $3,145.83
– Price: $3,337.87
On the hourly, Ethereum price is trading well above the 20, 50, and 200 EMAs with clean separation between them, a textbook short-term uptrend. Pullbacks into the 20 EMA around $3,280 have been natural buy-the-dip zones lately. A deeper retest of $3,210–3,150 would still leave the hourly structure comfortably bullish, just more mean-reverted.
RSI on H1
– RSI 14 (1H): 75.69
Hourly RSI is overheating. We are in the region where short-term traders often start to fade moves or at least lock in profits. That does not mean an immediate top, but it does mean risk is skewed toward consolidation or a pullback rather than a straight-line continuation from here.
MACD on H1
– MACD line: 52.49
– Signal: 49.91
– Histogram: 2.58 (barely positive)
The MACD line is still above the signal, so the trend is intact, but the histogram has thinned out. Momentum is fading even as price is still grinding up. That kind of divergence often precedes sideways churn or a shallow correction, especially when combined with overbought RSI.
Bollinger Bands and ATR on H1
– Middle band: $3,266.95
– Upper band: $3,419.51
– Lower band: $3,114.38
– ATR 14 (1H): $32.50
On the hourly, the bands have expanded with price near the upper half of the envelope but not pinned at the extreme. Combined with a $32 intraday ATR, you are looking at 1% swings inside a still bullish channel. That is a good backdrop for active traders to work dips, but it is also a setup where late chasers can get punished if they buy just before a standard mean reversion swing.
Hourly pivot levels
– Pivot point (PP): $3,338.59
– R1: $3,341.92
– S1: $3,334.55
The hourly pivot cluster is extremely tight. We are hovering exactly on the pivot with R1 and S1 only a few dollars away. This usually precedes a volatility expansion: the market is coiling above support, but when it breaks, it tends to move fast. Watch how Ethereum price behaves around $3,335–3,345 in the next few hours, because that micro-zone will likely define the intraday direction.
15-minute chart: intraday execution context
The 15-minute (M15) is still labelled bullish, but momentum there has already cooled off, which lines up with the idea of a pause or short-term pullback rather than an immediate blow-off move higher.
EMAs on M15
– EMA 20: $3,332.21
– EMA 50: $3,304.08
– EMA 200: $3,205.18
– Price: $3,337.88
Price is slightly above the 20 EMA with decent separation from the 50 and 200 EMAs. Short-term trend is still up, but the slope has flattened a bit compared with the hourly. For execution, dips into $3,320–3,330 are the first place intraday traders will test the waters on the long side, with stronger structural support lower around $3,300 and $3,280.
RSI and MACD on M15
– RSI 14 (15m): 57.60
– MACD line: 6.05
– Signal: 7.81
– Histogram: -1.76 (slightly negative)
On the 15-minute chart, RSI has cooled back to the mid-range, and MACD has just rolled under its signal line. That is early evidence of short-term exhaustion after the latest push. The shorter time frame is now leaning toward a consolidation or mild pullback phase even while the hourly and daily remain up-trend biased. In other words, the micro picture is counter-trend relative to the higher timeframes, usually an opportunity to stalk better entries rather than a reason to panic.
Bollinger Bands and ATR on M15
– Middle band: $3,335.61
– Upper band: $3,348.59
– Lower band: $3,322.63
– ATR 14 (15m): $8.10
Price is hovering right around the middle band with a modest $8 ATR. That is a calm consolidation inside a larger uptrend. Short-term, Ethereum price is catching its breath, not breaking down.
Market context: ETH is bullish, but not leading the pack
Total crypto market cap north of $3.33 trillion and a 3.5% daily increase, alongside a 54% jump in volume, signal a risk-on day for crypto overall. Yet Bitcoin still commands about 57% of total market capitalization, while ETH sits near 12%. This is a Bitcoin-led risk-on phase where Ethereum is benefiting, but not the primary driver.
DeFi activity (Uniswap v3, v4, Curve, and others) shows strong fee growth over the last month, which indirectly supports Ethereum’s long-term narrative, but those flows do not necessarily dictate intraday direction. For the current move, price structure and leveraged trading flows matter more than protocol fundamentals.
Ethereum price – bullish and bearish scenarios
Bullish scenario (primary bias from D1)
The main scenario, based on the daily chart, is cautiously bullish. Trend and momentum are aligned to the upside. As long as Ethereum price holds above the $3,250–3,280 region on closing basis, pullbacks are more likely to be bought than to morph into a full reversal.
In the bullish path, we first need to see:
1) Intraday hold above $3,313 (daily S1) and ideally above the cluster around $3,330–3,340 (hourly pivots). If buyers continue to defend those levels on dips, the immediate pressure stays upward.
2) Clean breakout above $3,362–3,370 (daily R1 area) with hourly closes holding above that range. That would confirm continuation and open room toward the upper hourly band near $3,420, followed by a potential extension toward $3,500 if BTC keeps leading the market higher.
In this bullish case, daily RSI can push into the 70–75 band while price rides or even overshoots the upper Bollinger Band. MACD would likely continue widening in favor of the bulls on both daily and hourly charts. The key here: upside continuation remains more probable as long as dips remain shallow and are absorbed before testing the 20-day EMA around $3,130.
What invalidates the bullish case?
A decisive daily close below $3,250–3,280 would be a warning shot, but the cleaner invalidation for this upside structure is a daily close back under the 200-day EMA near $3,295, especially if accompanied by a sharp rollover in RSI back toward 50. That would indicate the breakout above the 200-day was a fake-out and shift the bias from buy-the-dip to sell-the-rally on the next bounce.
Bearish / corrective scenario
Despite the bullish daily bias, the shorter-term signals are showing fatigue, notably the overheated hourly RSI and flattening hourly MACD, plus the small momentum roll-over on 15m. That opens the door to a pullback, even if it is only corrective for now.
In the bearish or corrective path, you would be looking for:
1) Failure to hold above $3,313 with hourly and 4H candles starting to close below that level, turning today’s pivot cluster into resistance rather than support.
2) Follow-through selling toward $3,280–3,250, where the 1H 20 EMA and recent breakout area sit. A decisive break below that zone would suggest short-term control shifting toward sellers and open a move toward the 20-day EMA around $3,130 and the Bollinger mid-band near $3,100.
On this path, daily RSI would likely roll down toward 55–50, and MACD histogram would contract. Ethereum price returning to the middle of the daily Bollinger Bands would mark a proper mean reversion, rather than just intraday noise.
What invalidates the bearish / corrective case?
If ETH can push through $3,370 and hold above that on the hourly while hourly RSI remains elevated but stable (no sharp reversal) and MACD expands again, the near-term correction thesis is off the table. That would mean this was simply a consolidation at the highs before another expansion leg.
How to think about positioning here
Across timeframes, the story is reasonably consistent: the daily trend is up, the hourly is up but stretched, and the 15-minute is cooling off. Those are bullish conditions with short-term exhaustion. This is typically not where disciplined traders start a high-conviction swing long with no plan; it is where they either manage existing longs or wait for better entries after a dip.
Key zones to watch on Ethereum price in the next sessions:
– Immediate intraday band: $3,313–3,362 (daily S1 to R1). Holding above the lower edge keeps the uptrend intact intraday.
– Short-term trend defense: $3,250–3,280. That is where hourly trend followers are likely to step in if we get a deeper flush.
– Daily trend line in the sand: 200-day EMA around $3,295 and the 20-day EMA at $3,130. Losing that cluster would shift the broader narrative from an advancing market to a choppy or corrective one.
Volatility is high enough that both bulls and bears can get squeezed if they size positions as if Ethereum price were still in a low-vol regime. Anyone trading this move needs to be aware that a normal daily swing of plus or minus $100 or more is on the table and that intraday ranges of 1–2% are baseline noise, not a regime change.
Overall, the edge here comes from respecting the higher-timeframe uptrend while acknowledging that momentum is stretched on lower timeframes. Until proven otherwise, dips are opportunities in a bull market, but entries and risk limits matter more than usual when price is sitting this close to resistance.
If you want to monitor markets with professional charting tools and real-time data, you can open an account on Investing using our partner link:
Open your Investing.com account
This section contains a sponsored affiliate link. We may earn a commission at no additional cost to you.
Disclaimer: This analysis is for informational and educational purposes only and is based solely on the technical data provided. It does not constitute investment advice, a recommendation, or an offer to buy or sell any financial instrument. Cryptoassets are highly volatile and can result in total loss. Always conduct your own research and consider your risk tolerance before making trading decisions.


You May Also Like

Strait of Hormuz Crisis: Macron’s Stark Warning Against Military Action

Fed Governor Calls For Strong Stablecoin Oversight As CLARITY Act’s Final Text Gets Delayed


