The post Dash Price Prediction 2026, 2027 – 2030: Forecast, Targets & Growth Potential appeared first on Coinpedia Fintech News Story Highlights The live price The post Dash Price Prediction 2026, 2027 – 2030: Forecast, Targets & Growth Potential appeared first on Coinpedia Fintech News Story Highlights The live price

Dash Price Prediction 2026, 2027 – 2030: Forecast, Targets & Growth Potential

Dash Price Prediction

The post Dash Price Prediction 2026, 2027 – 2030: Forecast, Targets & Growth Potential appeared first on Coinpedia Fintech News

Story Highlights

  • The live price of the DASH coin is  $ 73.74737797.
  • The Dash price could reach a maximum of $1200 in 2026.
  • Dash price with a potential surge, may reach a high of $3206.16 by 2030.

Dash, short for digital cash, was created with a clear vision of becoming a fast, secure, and practical payment-focused cryptocurrency. Built to support decentralized applications and everyday transactions, Dash has spent much of its history oscillating between periods of explosive growth and prolonged consolidation. 

Its journey reflects the broader evolution of the crypto market, where early hype-driven rallies were followed by deep corrections, long accumulation phases, and renewed attempts at recovery.

Over the years, Dash has demonstrated resilience by repeatedly attracting demand during extended downtrends, signaling a persistent belief in its utility as a privacy-oriented payment network. 

Market cycles, macro shocks, and shifting investor sentiment have all shaped its price behavior, turning Dash into a classic example of a high-volatility asset with long-term structural patterns. By the end of twenty twenty five, Dash found itself at a critical juncture, having built a solid base after years of decline, setting the stage for renewed optimism around its future potential.

Now, investors are intrigued whether DASH can generate 1000% gains in 2026? To know in depth, read this article on DASH price prediction 2026 to 2030.

Dash Price Today

CryptocurrencyDash
TokenDASH
Price$73.7474 up 9.56%
Market Cap$ 925,732,177.16
24h Volume$ 1,247,381,976.0955
Circulating Supply12,552,746.9937
Total Supply12,552,746.9937
All-Time High$ 1,642.2200 on 20 December 2017
All-Time Low$ 0.2139 on 14 February 2014

Table of contents

  • Coinpedia’s DASH Price Prediction 2026
  • What Exactly Happened Till 2025 in Dash?
  • DASH Price Prediction 2026
  • DASH Long-Term Price Prediction 2027-2030
    • DASH Price Prediction 2027
    • DASH Token Price Projection 2028
    • DASH Crypto Price Prediction 2029
    • DASH Price Prediction 2030
  • FAQs

Coinpedia’s DASH Price Prediction 2026

DASH/USD has tightened after rising from $22 to $149 in Q4 2025. Recent bullish sentiment in privacy coins, driven by rising investor confidence and institutional interest, positions DASH for a potential breakout in 2026. Currently taken strong support around $50, a rise past $125 could target $400, with possibilities of reaching $1200 by the end of 2026, marking significant gains.

What Exactly Happened Till 2025 in Dash?

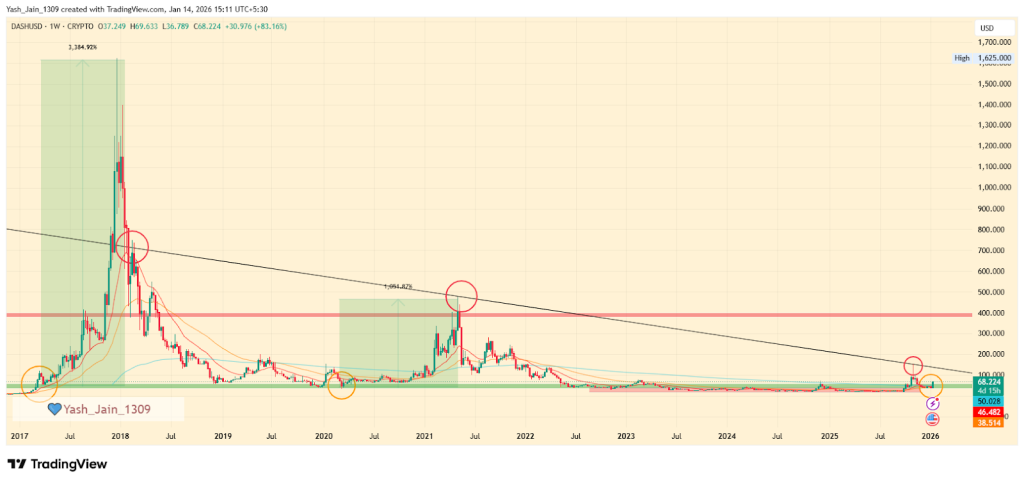
The DASH price has experienced significant developments following a prolonged period of consolidation beneath the $20 mark from the year 2014 to 2016. The dynamics surrounding DASH began to shift in the first quarter of 2017 when it surpassed the $100 threshold for the first time, ultimately closing the quarter in the vicinity of $50. But, things changed in the second quarter of 2017 marked the onset of a robust historic parabolic rally, propelling the price from $53 to an astonishing $1,625, which represented an increase of over 3,300% by the fourth quarter of 2017.

What exactly happened till 2025 in DASH

The year 2017 was particularly remarkable for DASH/USD, characterized by immense parabolic growth; however, this was followed by a severe correction in 2018 onwards. By the fourth quarter of 2019, the price had retraced to the demand area around $50, resulting in a loss of over 95% of its gains. The decline was as profound as the preceding rally.

From late 2019 through late 2020, signs of accumulation once again emerged due to renewed confidence in the cryptocurrency market this showed evident demand on $50 area again. But, throughout 2020, DASH price fluctuated only below the $110 level. A critical shift occurred in 2021 when the price broke through the weekly 200 EMA band in early 2021, leading to an recovery rally of over 1,000% to $481. However, this upward momentum was still squashed by the FTX crash, which triggered substantial resistance in the latter half of 2021. This year displayed a dichotomy, because the first half experienced growth while the second half succumbed to a decline.

DASHUSD Price

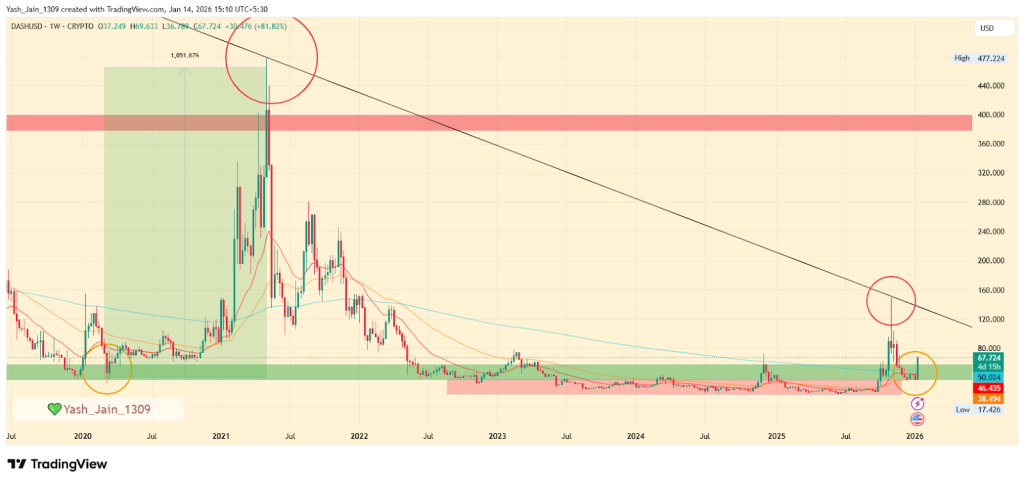
This downturn persisted until the third quarter of 2025, culminating in a low of $17.4. This extensive period of consolidation strongly indicates significant accumulation. In the fourth quarter of 2025, a recovery ensued, resulting in a spike to $149, although the year 2025 ultimately closed at $43.

DASH Price Analysis

Overall, the long-term price action illustrates a multi-year descending triangle pattern’s formation that’s a ready setup to potentially break upside in 2026. In the pattern, the $50 demand area serves as a critical support level. The descending trendline from the pattern effectively connects the price movements that constrained the momentum of DASH/USD. Moreover, the closure of 2025 was at a favorable juncture that has established a robust foundation, leading investors to place considerable optimism on the potential developments in 2026.

DASH Price Prediction 2026

The DASH/USD trading range has significantly tightened after making a remarkable ascent from October’s low of $22 to a resistance peak of $149, where it faced a setback in Q4 2025. However, the recent positive reaction of XMR in early January indicates a strong return of bullish sentiment in the privacy coins sector resonating in other privacy coins like DASH, too.

Now, DASH crypto’s bullish setup strongly suggests a powerful odds of resurgence, as investor confidence in privacy-oriented cryptocurrencies like ZEC and Monero continues to grow. This is largely driven by increased institutional involvement in Bitcoin and DeFi, along with rising concerns over data exposure and financial surveillance in an increasingly regulated digital landscape, which is boosting the overall privacy sector.

Given DASH’s status as a popular privacy asset, a significant reaction is imminent when the right catalyst is met. Also, the multiyear setup to break out for good in 2026 appears highly promising.

DASH price prediction 2026

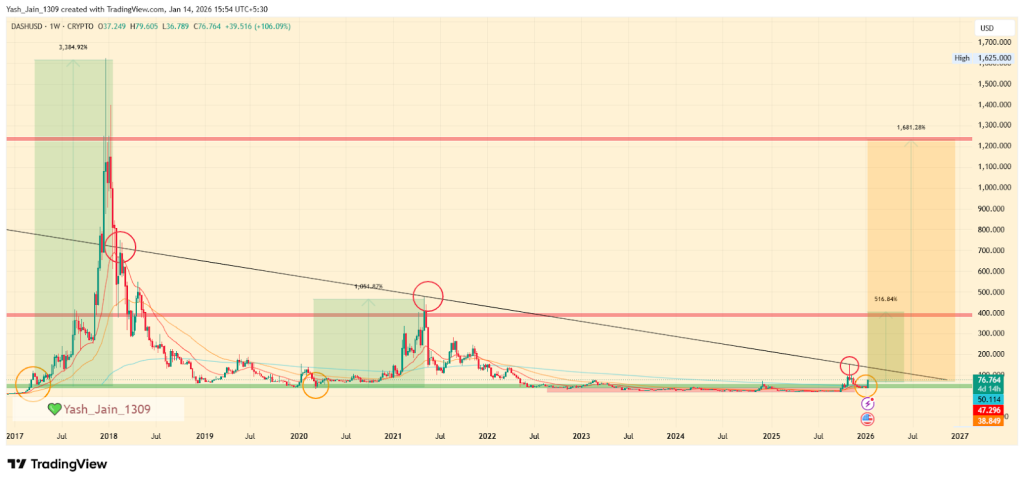
While the current DASH/USD price is still below its all-time high, the trend reveals a strong renewed appetite for privacy assets. The DASH price is currently experiencing a bullish reaction from the $50 area in early January 2026. Once it breaks through the $125 mark, the next ambitious target is set at $400, representing a remarkable 516% increase. 

Should it achieve this, the end of 2026 could see a potential extension of the rally towards $1200, resulting in an astounding gain of over 1600% from its current market price.

DASHUSD 1W Chart

DASH Long-Term Price Prediction 2027-2030

YearPotential Low ($)Potential Average ($)Potential High ($)
2027917.891435.781653.67
20281326.831653.671980.51
20291490.241980.512470.77
20301735.362470.773206.16

DASH Price Prediction 2027

As the adoption constantly increases, the projected price of this altcoin may vary between $917.89 and $1653.67, with an average of $1435.78.

DASH Token Price Projection 2028

With the next Bitcoin Halving scheduled this year, the Dash price may fluctuate between $1326.83 and $1980.51, with an average of $1653.67.

DASH Crypto Price Prediction 2029

Anticipating the start of a new crypto bull cycle, this altcoin could range between $1490.24 to $2470.77, with an average price of $1980.51.

DASH Price Prediction 2030

By 2030, the price of Dash crypto token may range between $1735.36 to $3206.16. Considering the high and low, it could settle the year with an average trading price of $2470.77.

Never Miss a Beat in the Crypto World!

Stay ahead with breaking news, expert analysis, and real-time updates on the latest trends in Bitcoin, altcoins, DeFi, NFTs, and more.

bell icon Subscribe to Price Prediction

FAQs

What is Dash and how does it work?

Dash is a fast, secure cryptocurrency designed for everyday payments, supporting decentralized applications and privacy-focused transactions.

What is the Dash price prediction for 2026?

Dash could rise from $50 to $400 in 2026, with a potential high of $1200 if bullish momentum continues in privacy-focused crypto.

What is the Dash price prediction for 2027?

Dash may range between $917 and $1653 in 2027 as adoption grows and market conditions favor privacy-oriented cryptocurrencies.

What is the Dash price prediction for 2028?

Dash could trade between $1326 and $1980 in 2028, influenced by Bitcoin halving events and increasing investor interest in privacy coins.

What is the Dash price prediction for 2030?

Dash could range from $1735 to $3206 by 2030, reflecting long-term growth, adoption, and continued demand for privacy-focused crypto assets.

Is Dash a good investment for privacy-focused crypto?

Dash remains a strong choice for privacy payments, offering fast transactions and long-term growth potential for investors seeking secure digital cash.

Market Opportunity
DASH Logo
DASH Price(DASH)
$83.98
$83.98$83.98
-0.81%
USD
DASH (DASH) Live Price Chart
Disclaimer: The articles reposted on this site are sourced from public platforms and are provided for informational purposes only. They do not necessarily reflect the views of MEXC. All rights remain with the original authors. If you believe any content infringes on third-party rights, please contact service@support.mexc.com for removal. MEXC makes no guarantees regarding the accuracy, completeness, or timeliness of the content and is not responsible for any actions taken based on the information provided. The content does not constitute financial, legal, or other professional advice, nor should it be considered a recommendation or endorsement by MEXC.

You May Also Like

Is Hyperliquid the new frontier for innovation?

Is Hyperliquid the new frontier for innovation?

The post Is Hyperliquid the new frontier for innovation? appeared on BitcoinEthereumNews.com. This is a segment from the 0xResearch newsletter. To read full editions, subscribe. One of the key things I like to track in crypto is a subjective criterion I call “where are new interesting developments and proposals taking place.” There are plenty of dashboards and analytics sites for this, the most popular being the Electric Capital site. The issue is that it still shows Polkadot as having a lot of developers. (At Blockworks we solved the noise problem with active users; maybe we can try the same for active developers.) Because of this noise, I prefer to track two simple observations: What is the velocity of new products launching, and how much mindshare are these products capturing? Are many people getting nerdsniped into discussing the novelties and intricacies of the chain? A related point is the caliber of people being attracted to new ecosystems. For example, over the past few years, Solana (and Ethereum) attracted the majority of talent. Talent generally goes where: It can solve interesting problems or create interesting projects. It can make a lot of money. In a podcast I did with Icebergy about a year ago, we discussed how crypto still wasn’t attracting talent at the levels AI was, despite offering faster exits and more money. AI was (and probably still is) more interesting to most talent and seen as more prestigious. After FTX, crypto lost a lot of credibility and has only recently started recovering as larger institutional players re-entered. Apart from FTX, crypto has also been criticized for being full of low-effort forks and limited utility products. This dynamic isn’t unique to crypto though. Many AI companies are also just building wrappers around GPT, which is as uninteresting as some projects in crypto. Anyway, to the point: Historically, Solana has captured the majority of…
Share
BitcoinEthereumNews2025/09/18 08:13
Stronger capital, bigger loans: Africa’s banking outlook for 2026

Stronger capital, bigger loans: Africa’s banking outlook for 2026

African banks spent 2025 consolidating, shoring up capital, tightening risk controls, and investing in digital infrastructure, following years of macroeconomic
Share
Techcabal2026/01/14 23:06
Crucial US Stock Market Update: What Wednesday’s Mixed Close Reveals

Crucial US Stock Market Update: What Wednesday’s Mixed Close Reveals

BitcoinWorld Crucial US Stock Market Update: What Wednesday’s Mixed Close Reveals The financial world often keeps us on our toes, and Wednesday was no exception. Investors watched closely as the US stock market concluded the day with a mixed performance across its major indexes. This snapshot offers a crucial glimpse into current investor sentiment and economic undercurrents, prompting many to ask: what exactly happened? Understanding the Latest US Stock Market Movements On Wednesday, the closing bell brought a varied picture for the US stock market. While some indexes celebrated gains, others registered slight declines, creating a truly mixed bag for investors. The Dow Jones Industrial Average showed resilience, climbing by a notable 0.57%. This positive movement suggests strength in some of the larger, more established companies. Conversely, the S&P 500, a broader benchmark often seen as a barometer for the overall market, experienced a modest dip of 0.1%. The technology-heavy Nasdaq Composite also saw a slight retreat, sliding by 0.33%. This particular index often reflects investor sentiment towards growth stocks and the tech sector. These divergent outcomes highlight the complex dynamics currently at play within the American economy. It’s not simply a matter of “up” or “down” for the entire US stock market; rather, it’s a nuanced landscape where different sectors and company types are responding to unique pressures and opportunities. Why Did the US Stock Market See Mixed Results? When the US stock market delivers a mixed performance, it often points to a tug-of-war between various economic factors. Several elements could have contributed to Wednesday’s varied closings. For instance, positive corporate earnings reports from certain industries might have bolstered the Dow. At the same time, concerns over inflation, interest rate policies by the Federal Reserve, or even global economic uncertainties could have pressured growth stocks, affecting the S&P 500 and Nasdaq. Key considerations often include: Economic Data: Recent reports on employment, manufacturing, or consumer spending can sway market sentiment. Corporate Announcements: Strong or weak earnings forecasts from influential companies can significantly impact their respective sectors. Interest Rate Expectations: The prospect of higher or lower interest rates directly influences borrowing costs for businesses and consumer spending, affecting future profitability. Geopolitical Events: Global tensions or trade policies can introduce uncertainty, causing investors to become more cautious. Understanding these underlying drivers is crucial for anyone trying to make sense of daily market fluctuations in the US stock market. Navigating Volatility in the US Stock Market A mixed close, while not a dramatic downturn, serves as a reminder that market volatility is a constant companion for investors. For those involved in the US stock market, particularly individuals managing their portfolios, these days underscore the importance of a well-thought-out strategy. It’s important not to react impulsively to daily movements. Instead, consider these actionable insights: Diversification: Spreading investments across different sectors and asset classes can help mitigate risk when one area underperforms. Long-Term Perspective: Focusing on long-term financial goals rather than short-term gains can help weather daily market swings. Stay Informed: Keeping abreast of economic news and company fundamentals provides context for market behavior. Consult Experts: Financial advisors can offer personalized guidance based on individual risk tolerance and objectives. Even small movements in major indexes can signal shifts that require attention, guiding future investment decisions within the dynamic US stock market. What’s Next for the US Stock Market? Looking ahead, investors will be keenly watching for further economic indicators and corporate announcements to gauge the direction of the US stock market. Upcoming inflation data, statements from the Federal Reserve, and quarterly earnings reports will likely provide more clarity. The interplay of these factors will continue to shape investor confidence and, consequently, the performance of the Dow, S&P 500, and Nasdaq. Remaining informed and adaptive will be key to understanding the market’s trajectory. Conclusion: Wednesday’s mixed close in the US stock market highlights the intricate balance of forces influencing financial markets. While the Dow showed strength, the S&P 500 and Nasdaq experienced slight declines, reflecting a nuanced economic landscape. This reminds us that understanding the ‘why’ behind these movements is as important as the movements themselves. As always, a thoughtful, informed approach remains the best strategy for navigating the complexities of the market. Frequently Asked Questions (FAQs) Q1: What does a “mixed close” mean for the US stock market? A1: A mixed close indicates that while some major stock indexes advanced, others declined. It suggests that different sectors or types of companies within the US stock market are experiencing varying influences, rather than a uniform market movement. Q2: Which major indexes were affected on Wednesday? A2: On Wednesday, the Dow Jones Industrial Average gained 0.57%, while the S&P 500 edged down 0.1%, and the Nasdaq Composite slid 0.33%, illustrating the mixed performance across the US stock market. Q3: What factors contribute to a mixed stock market performance? A3: Mixed performances in the US stock market can be influenced by various factors, including specific corporate earnings, economic data releases, shifts in interest rate expectations, and broader geopolitical events that affect different market segments uniquely. Q4: How should investors react to mixed market signals? A4: Investors are generally advised to maintain a long-term perspective, diversify their portfolios, stay informed about economic news, and avoid impulsive decisions. Consulting a financial advisor can also provide personalized guidance for navigating the US stock market. Q5: What indicators should investors watch for future US stock market trends? A5: Key indicators to watch include upcoming inflation reports, statements from the Federal Reserve regarding monetary policy, and quarterly corporate earnings reports. These will offer insights into the future direction of the US stock market. Did you find this analysis of the US stock market helpful? Share this article with your network on social media to help others understand the nuances of current financial trends! To learn more about the latest stock market trends, explore our article on key developments shaping the US stock market‘s future performance. This post Crucial US Stock Market Update: What Wednesday’s Mixed Close Reveals first appeared on BitcoinWorld.
Share
Coinstats2025/09/18 05:30