

Solana Price Today (SOLUSDT): Bullish Phase Above $145, Short-term Resistance Approaching

In the current market context, the Solana price is moving in a controlled rise above $145, with a constructive trend but increasingly narrow margins for error.
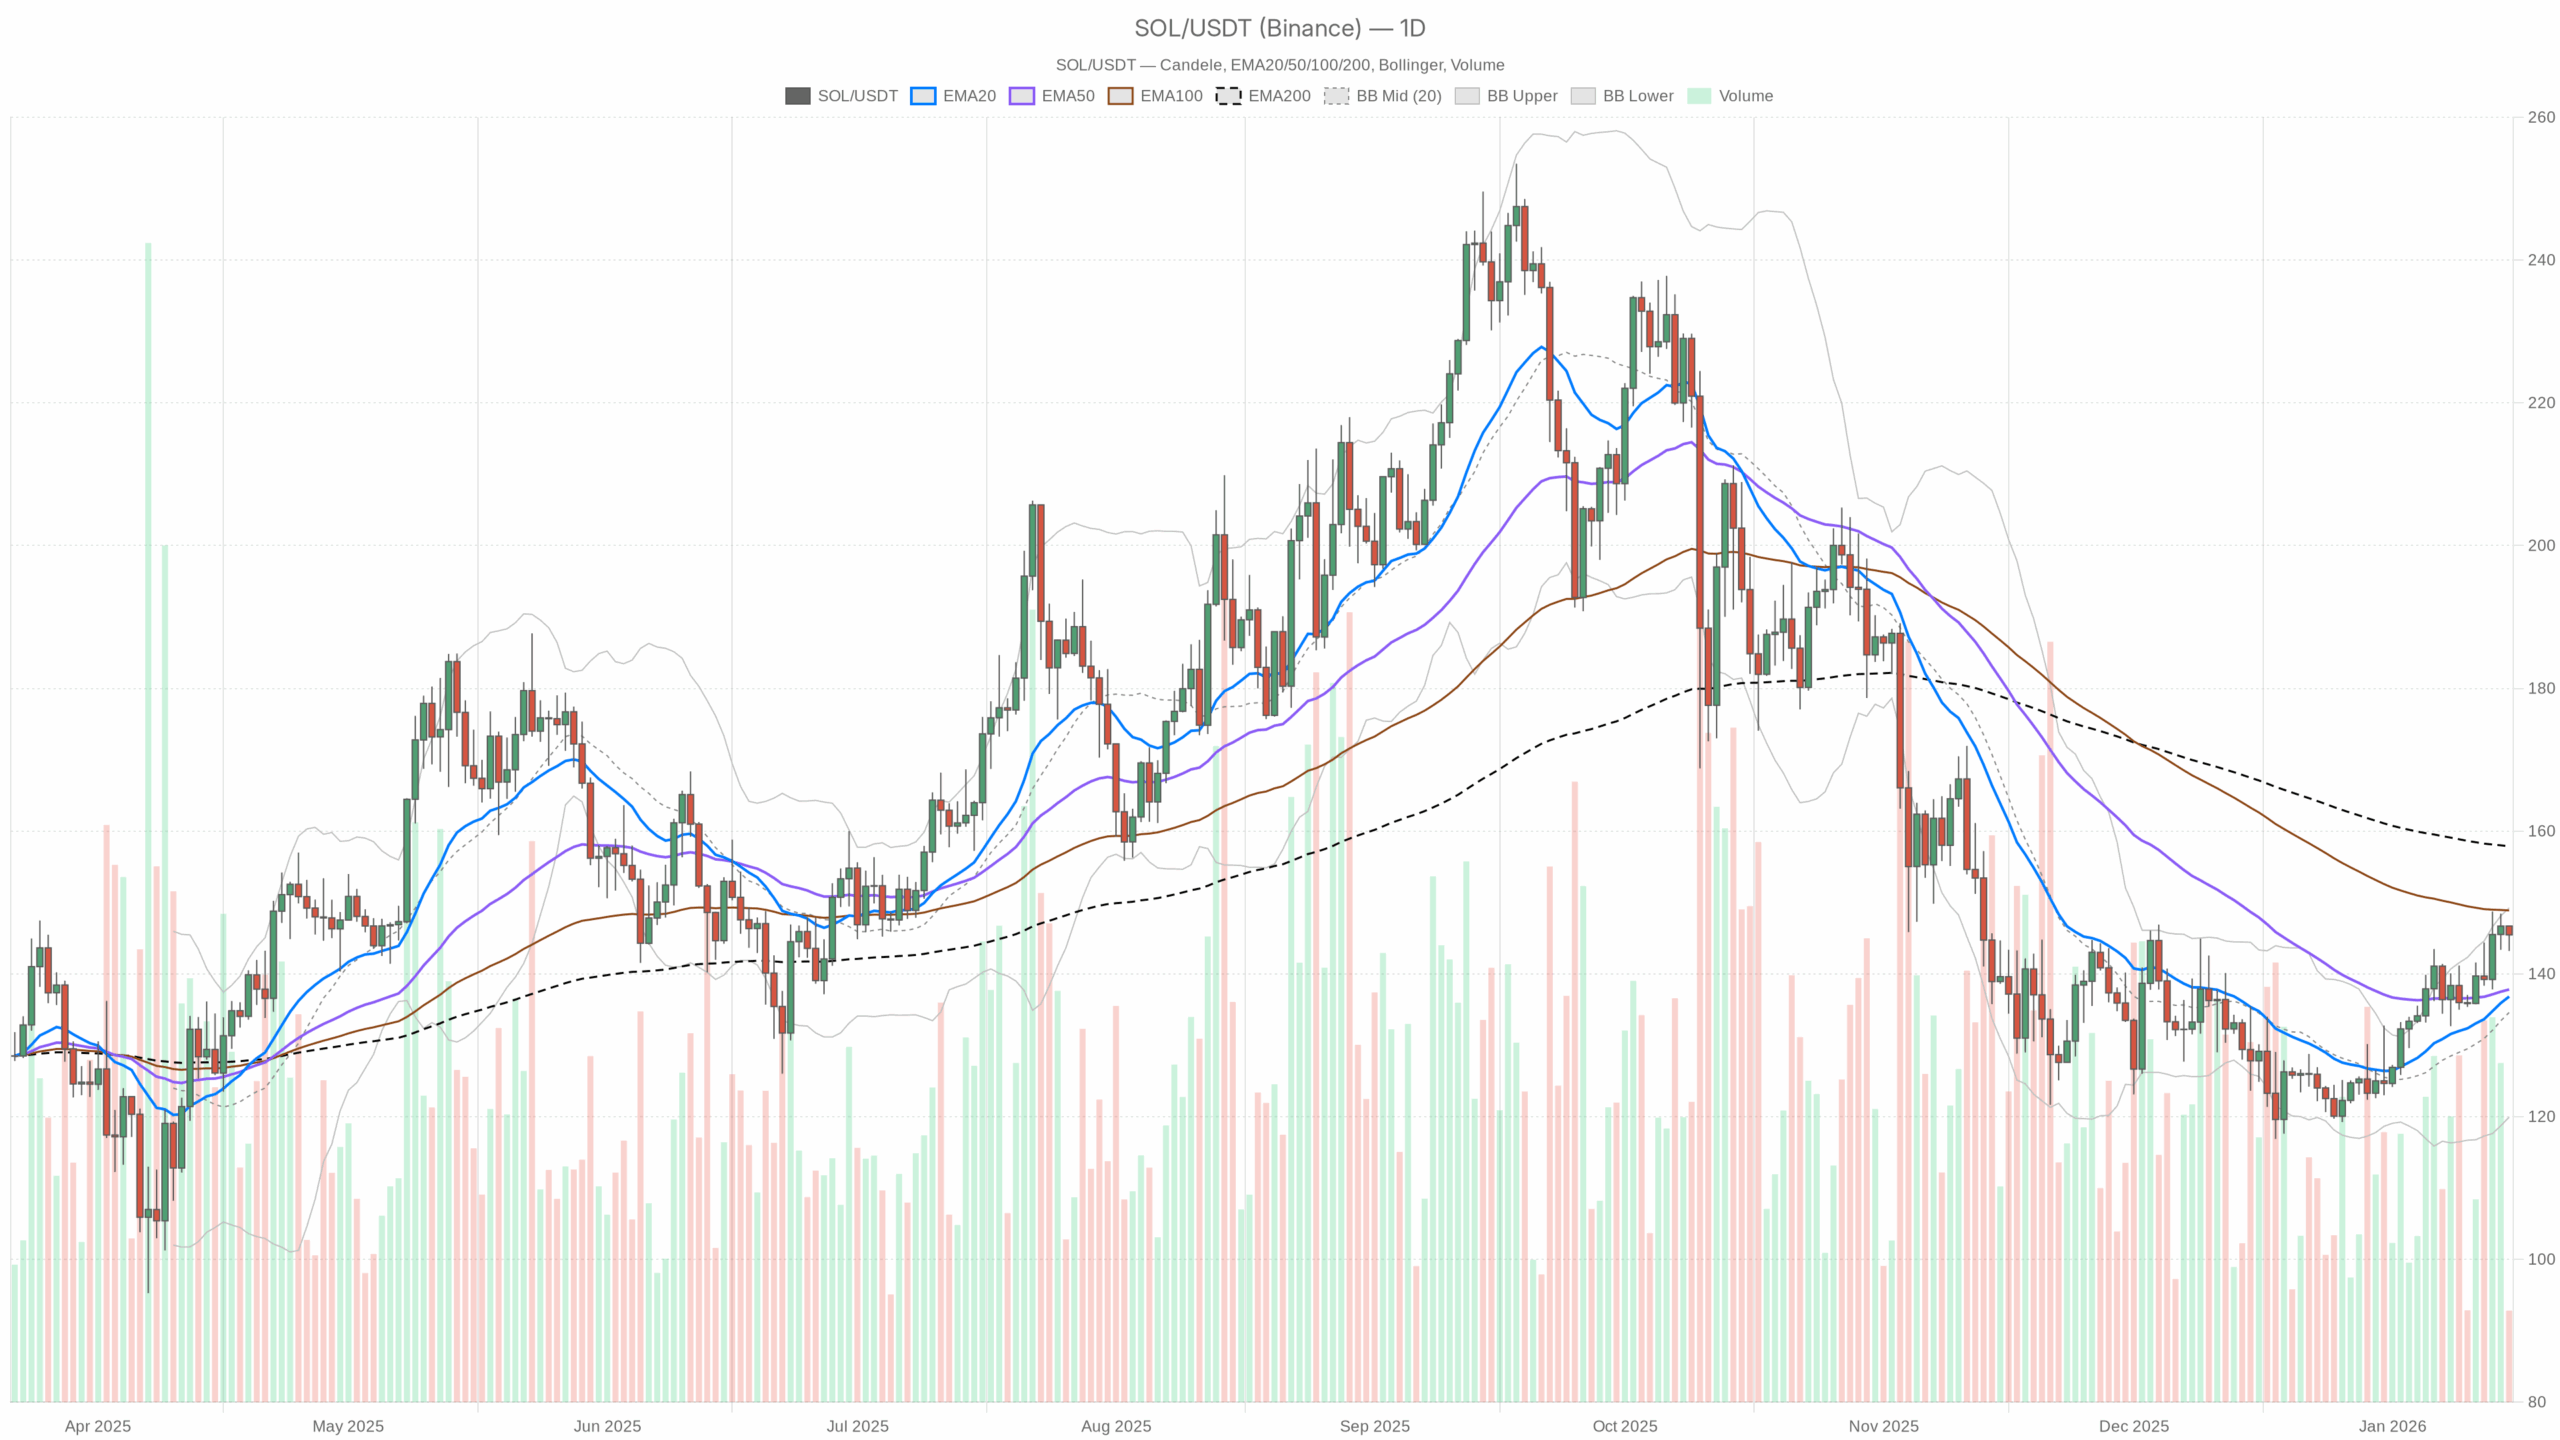 SOL/USDT with EMA20, EMA50 and volumes”
loading=”lazy” />SOL/USDT — daily chart with candles, EMA20/EMA50 and volumes.
Main Scenario on D1: Rise Above Average, but Below the 200
The price of Solana (SOLUSDT) today is moving around $145.5, in what I would define as a controlled rise: the underlying trend on the daily remains constructive, but we are increasingly close to a zone where aggressive profit-taking is easy to see.
The general crypto context is still favorable (Fear & Greed index at 61 – Greed), but not in full euphoria. In practice: there is a desire to take on risk, but any too rapid extension risks being sold.
On the daily chart Solana is quoted around $145.46, above the fast averages but still below the EMA 200, which is around $157.9. This is an important detail: the market is buying the pullbacks, but the real medium-term wall remains higher.
EMA (Exponential Moving Averages) – D1
- EMA 20: $136.82
- EMA 50: $137.81
- EMA 200: $157.88
The price is well above EMA 20 and 50, with the two averages practically aligned and below the price, while the 200 remains higher. This indicates a short-medium term bullish trend, still embedded in a longer-term structure that has not been fully reclaimed. As long as we stay above $137–138, buyers have operational control; above $158 we would have a stronger signal of structural recovery.
Daily RSI (D1)
- RSI 14: 65.26
The RSI is in a bullish zone but not extreme. This indicates a positive push, with residual room for another leg up before entering the overbought area. In simple terms: the market is bought, but not yet in full overheating. The first real overbought tensions start above about 70.
Daily MACD (D1)
- MACD line: 3.79
- Signal: 2.24
- Histogram: 1.55 (positive)
The MACD is positive and above the signal, with the histogram also positive. Translated: the underlying momentum remains in favor of buyers, with no evident signs of bearish reversal on the daily. The phase is not explosive, but consistent with a progressive rise.
Daily Bollinger Bands (D1)
- Median: $134.59
- Upper Band: $149.24
- Lower Band: $119.93
The price is near the upper band ($145.46 against $149.24). This means that Solana is trading in the upper part of its recent volatility range: a typical behavior of healthy bullish trends, but also a zone where the probabilities of technical pullbacks or lateral consolidations increase. A daily close above $149–150 would be a marked signal of strength, while repeated rejections below that range could indicate the start of short-term distribution.
Daily ATR (D1)
- ATR 14: $5.85
The ATR indicates an average daily volatility around $6. In practice, daily movements of 3–4% up or down are perfectly normal on SOL at this time. For those operating in the short term, positions without adequate room for stop risk being wiped out by normal market noise.
Daily Pivot Points (D1)
- Central Pivot (PP): $145.13
- Resistance R1: $147.06
- Support S1: $143.54
The current price ($145.46–145.5) is close to the daily pivot, slightly above. This positioning suggests a fragile balance: small buying flows could push towards $147, while a weak session would be enough to quickly return to the $143.5 area. In practice, we are at an intraday decision point rather than in an extreme zone.
H1: Trend Still Bullish, but Momentum Slowing
On the hourly chart, Solana is quoted around $145.49. The hourly regime is classified as bullish, but signs of cooling momentum are beginning to emerge.
EMA on H1
- EMA 20: $145.24
- EMA 50: $144.44
- EMA 200: $140.53
Price above all averages, with a good bullish structure: the averages are arranged in the correct order (price > EMA 20 > EMA 50 > EMA 200). The distance from the 200 is wide, indicating that the rise in recent sessions has been decisive. However, the angle of ascent of the faster averages is moderating: the trend remains positive, but more mature.
RSI on H1
- RSI 14: 52.31
The hourly RSI has returned close to the neutral zone. This indicates that, in the short term, the euphoria has already dissipated: the market is neither stretched to the upside nor the downside. It is a typical context for a pause or redistribution phase after a previous movement.
MACD on H1
- MACD line: 0.05
- Signal: 0.12
- Histogram: -0.07 (slightly negative)
The hourly MACD is showing a slight slowdown in bullish momentum: MACD line just below the signal, histogram slightly negative. It is not yet a strong reversal signal, but more of a warning that the bullish movement is catching its breath. If this divergence extends and the price does not update the highs, the risk of intraday correction increases.
Bollinger Bands on H1
- Median: $145.62
- Upper Band: $147.74
- Lower Band: $143.50
The price is just below the median, in the upper third of the channel but not in contact with the upper band. This setup suggests a consolidation phase near local highs, with room for either a new test of the upper band (around $147.7) or a return towards the center of the range.
ATR and Pivot on H1
- ATR 14 H1: $1.10
- Pivot H1 (PP): $145.48
- Resistance R1 H1: $145.62
- Support S1 H1: $145.34
The hourly volatility is contained, with a typical range of about $1 per hour. The price is practically glued to the hourly pivot, between very close R1 and S1: a perfect context for chop and false intraday breakouts, especially for those working with high leverage and tight stops.
M15: Micro-Rise, but Very Delicate Technical Area
On the 15 minutes, SOL is at $145.5, with a slightly bullish picture but without explosiveness. It is the classic scenario where the price can break upwards or quickly stall.
EMA on M15
- EMA 20: $145.10
- EMA 50: $145.15
- EMA 200: $144.57
Price just above the fast averages, which are very close to each other: a signal of a micro-bullish trend but not particularly directional. The 200 at $144.57 acts as an important intraday dynamic support: as long as we stay above, very short-term buyers remain in control.
RSI and MACD on M15
- RSI 14 M15: 57.05
- MACD line: 0.18
- Signal: 0.09
- Histogram: 0.09 (positive)
RSI above 50 and MACD slightly positive indicate a short-term bullish push still alive, but not extreme. It is an ideal context for long scalping as long as the price continues to respect rising lows; however, just a couple of decisive red candles are enough to quickly reverse this balance.
Bollinger Bands and Pivot on M15
- Median BB M15: $144.94
- Upper Band: $145.97
- Lower Band: $143.91
- Pivot M15 (PP): $145.48
- R1 M15: $145.63
- S1 M15: $145.35
The price travels between the median and the upper band and, again, practically on the pivot. This setup confirms the idea of a micro-rise in an area of equilibrium: the market has room for an extension towards $146–147, but also for a return towards $145–144.5 without the underlying trend being truly compromised.
Multi-Timeframe Summary: Bullish, but Not Foolproof
- D1: Bullish structure above fast averages, positive momentum but near the upper part of the Bollinger Bands.
- H1: Rise still present, but with cooling momentum (weakened MACD, neutral RSI).
- M15: Intact micro-rise, but near key technical levels, easy to spoil with false breakouts.
The overall picture remains bullish, but with a clear signal: the easy phase of the movement may already be behind us. From here on, sensitivity to profit-taking increases and the risks of traps for those entering late.
Bullish Scenario on Solana Price (SOLUSDT)
The bullish scenario starts from the idea that the current price of Solana manages to consolidate above the $143–145 zone and attract new buyers on any small pullbacks.
What Buyers Need
- Keep the Solana price today steadily above the daily pivot at $145.1.
- Defend the support range $143.5–144 (S1 daily plus EMA 20–50 zone on lower timeframes).
- Push towards and beyond $147–149, which coincides with R1 daily and the upper band of the Bollinger Bands.
If this script plays out, the price chart of Solana could draw a sequence of rising highs and lows with progressive targets:
- First target: $149–150 (daily upper band, round psychological resistance).
- Second extended target: $155–158, where the daily EMA 200 passes. Here I expect strong friction: it is a level that the market sees.
In this scenario, the Solana USD quotation would remain oriented upwards and any retracement towards $140–142 would likely be seen as a buying opportunity by position traders.
Levels That Invalidate the Bullish Scenario
- Daily closes below $140, which would bring the price back inside or below the fast averages range.
- Daily RSI that falls steadily below 50, signaling that control passes back to sellers.
- Net loss of the daily EMA 50 ($137.8) with increased selling volumes: this would be a strong warning bell for those long in the medium term.
Bearish Scenario on Solana Price
The bearish scenario relies on the idea that the current value of Solana in the $145–147 area is more a distribution zone than a base for a restart. In this case, the market would have already started unloading positions in profit above $140.
What Sellers Need
- Repeated rejection of the $147–149 area with reversal candles and increasing volumes.
- Decisive break of $143.5 (S1 daily) and subsequent consolidation below $143.
- Downward inclination of the daily EMA 20 and 50, with the price remaining below them for several sessions.
If this scenario takes hold, the bearish targets become:
- First support: $140–141, psychological threshold and area where the first rebound attempt can be expected.
- Next support: $136–138, key area because it coincides with the daily fast averages. A clean break here would open space towards $130.
In this framework, the live Solana price might still appear relatively high compared to the medium-term structure, and intraday rebounds would likely be used to lighten long positions rather than build new ones.
Levels That Invalidate the Bearish Scenario
- Stable daily closes above $150, which would signal the strength of buyers even on key resistances.
- Reclaim and hold of the daily EMA 200 at $157–158.
- Daily RSI rising above 70 without immediate reversal, signaling a true breakout phase, not just a temporary excess.
How to Read the Current Context if You Trade SOL
Net of all the numbers, the market message is quite clear:
- The current price of Solana is embedded in an underlying bullish trend on the daily.
- Lower timeframes (H1, M15) show a consolidation phase after the movement, rather than a new decisive impulse.
- The volatility is such that movements of a few dollars do not change the direction, but can easily trigger too tight stops.
For those looking at the market from an operational perspective:
- Short-term traders (intraday/scalping): the $145–147 zone is as interesting as it is dangerous. The price is above the averages but resting on close pivots: false breakouts above $147 or false breaks below $143.5 are very likely. It makes sense to think more in terms of reaction to levels than chasing the price.
- Position traders: the daily chart remains constructive as long as SOL stays above $137–140. The real structural test will be in the $150–158 zone. Until then, the current rise can be seen as an intermediate leg within a broader reconstruction process.
The main risk in a context like this is confusing a consolidation at the top with an imminent breakout and buying too late, just when the probability of correction increases. Conversely, those already long still have the underlying trend on their side, but must accept that, at these levels, volatility can work against them in very short times.
For those monitoring the Solana price in real-time, the levels to watch in the coming sessions remain:
- Key supports: $143.5, $140, $137–138.
- Key resistances: $147–149, $150, $155–158.
As always with volatile assets like Solana, indicators offer context, not certainties: the market can remain irrational longer than a single technical signal might suggest. Working with clear alternative scenarios and defined invalidation levels remains the best defense against false signals and sudden sentiment changes.
If you want to monitor the markets in real-time with advanced charts and professional tools, you can open an account on Investing.com!:
Open your Investing.com account
This section contains a sponsored affiliate link. We may earn a commission but at no additional cost to you.
Disclaimer: The information contained in this article is for informational purposes only and does not constitute investment advice or a solicitation to save. Cryptocurrency trading involves a high level of risk and may not be suitable for all investors. Carefully consider your objectives, experience, and risk tolerance before trading in the markets.


You May Also Like

TOKEN2049 Dubai postponed: Why Paris matters next

Polymarket Adds Equities, Commodities via Pyth Price Feeds


