Solana is displaying an increasingly polarized split between chain usage and price action. According to data from Token Terminal, Solana apps now hold roughly $Solana is displaying an increasingly polarized split between chain usage and price action. According to data from Token Terminal, Solana apps now hold roughly $

Solana TVL Jumps 10x Since 2024 While SOL Tests Critical Levels

Solana is displaying an increasingly polarized split between chain usage and price action. According to data from Token Terminal, Solana apps now hold roughly $30 billion of user assets, up significantly from last year. Application TVL is up roughly tenfold since January 2024.

That increase represents steady usage of Solana-based platforms, even as market conditions have changed. The growing amount of assets on apps suggests that users are continuing to put money into the network rather than pulling out.

Source: X

Price Structure Still Signals Ongoing Correction

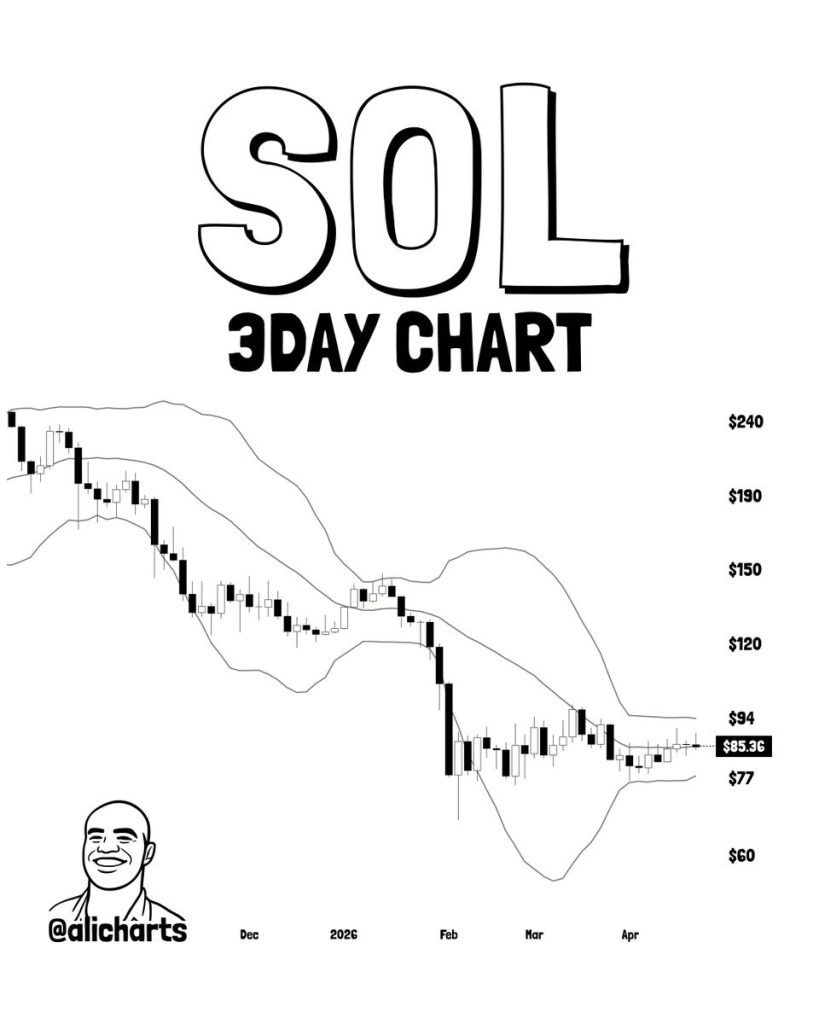
Even with solid app performance, SOL’s price shows lingering doubt. Right now, the trade looks like it’s still adjusting within a weakening phase. What we see so far fits a step back inside a broader downward trend. The move so far may just be one part of a broader slide, unfolding through a smaller correction phase. Price behavior now points to a deeper retreat unfolding beneath the surface.

A shift in perspective doesn’t erase what just happened – this dip still fits the pattern of an A-wave. That doesn’t rule out one more drop ahead; either a bounce starts here, or pressure builds for another spike upward. Looking closer, prices might swing back toward $81 up to $90 again.

Source: X

Also Read: Solana (SOL) Price Nears Breakout as ETF Inflows Return and $159 Comes Into Focus

Solana Weekly Chart Holds Key Long-Term Support

Solana is trying to find some stability on a weekly basis, as the price of Solana has been in a correction for quite some time now, since Solana was rejected at the upper Bollinger Bands ($240-$250). The current price of SOL ($144) is under both the 20-Week Exponential Moving Average (EMA) and 50-Week EMA, and this tells us there is still downward pressure on SOL from the Medium-Term perspective. However, Solana is currently above the 200-Week EMA ($123), a historical level of long-term support for Solana.

The past week’s candles reveal reduced upside or downside follow-through, indicating that downward pressure is waning at these levels. Bollinger Bands have begun to narrow after they had widened and, as such, are showing reduced volatility. Price is now trading in the lower part of the range for the Bollinger Band, but has yet to decisively drop through the lower Bollinger Band.

The RSI is currently near 44 and is beginning to trend upward toward neutral, and the MACD is still negative, but the size of the histogram bars continues to shrink. If price can sustain a move above the middle Bollinger Band (near $169), then we will see an improvement in the technicals; if price breaks down below $123, then we could potentially see a larger pullback.

Source: Tradingview

Also Read: Solana (SOL) Price Strengthens After $10.8M ETF Inflows, Bulls Target $180

Market Opportunity
Solana Logo
Solana Price(SOL)
$143,06
$143,06$143,06
-0,30%
USD
Solana (SOL) Live Price Chart
Disclaimer: The articles reposted on this site are sourced from public platforms and are provided for informational purposes only. They do not necessarily reflect the views of MEXC. All rights remain with the original authors. If you believe any content infringes on third-party rights, please contact service@support.mexc.com for removal. MEXC makes no guarantees regarding the accuracy, completeness, or timeliness of the content and is not responsible for any actions taken based on the information provided. The content does not constitute financial, legal, or other professional advice, nor should it be considered a recommendation or endorsement by MEXC.

You May Also Like

XRP Crowned South Korea’s Most-Traded Crypto of 2025

XRP Crowned South Korea’s Most-Traded Crypto of 2025

XRP Surpasses Bitcoin and Ethereum as South Korea’s Most Traded Crypto in 2025According to renowned market analyst X Finance Bull, XRP dominated South Korea’s crypto
Share
Coinstats2026/01/16 16:54
$683M to Nscale for 60,000 GPUs by 2026

$683M to Nscale for 60,000 GPUs by 2026

The post $683M to Nscale for 60,000 GPUs by 2026 appeared on BitcoinEthereumNews.com. Nvidia will invest $683 million in Nscale, the spin-off of Arkon Energy spun off in May 2024 to offer AI cloud services in Europe, with the goal of bringing up to 60,000 GPUs to the United Kingdom. The capital injection, in line with the push towards advanced AI infrastructure, is part of a joint effort to strengthen strategic computing capabilities in the region; the rollout is planned in stages between 2025 and 2026. The operation also coincides with the UK government’s plan to accelerate AI adoption and security, outlined by the government on January 13, 2025. According to data collected by industry analysts, updated as of September 17, 2025, projects that convert mining sites into AI nodes can reduce the time-to-market compared to new facilities by about 30–50%. Our field market analyses indicate typical improvements in PUE in the range of 10–20% after energy optimization interventions and the introduction of liquid cooling. Operators we have monitored also report that long-term energy contracts and proximity to major interconnection nodes are determining factors for the economic sustainability of the clusters. The Agreement in Brief: Figures, Goals, Timeline Investment: $683 million allocated to Nscale. Target capacity: up to 60,000 GPUs deployed in data centers in the United Kingdom. Timeline: phased rollout activity scheduled between 2025 and 2026. Origin Nscale: spin-off from Arkon Energy, created in May 2024 to enter the European market for AI cloud services. From miner to cloud AI: the Nscale spinoff Nscale is born from the conversion of mining assets into nodes for AI workloads, transforming facilities designed for energy-intensive and single-use operations into platforms with high computational value and greater flexibility. The strategy — based on the reuse of existing sites and network connections — allows for reduced startup times and capex, a significant advantage when targeting clusters dedicated…
Share
BitcoinEthereumNews2025/09/18 19:22
Why Bitcoin’s $100K “Resistance” Is Artificial, Not Technical

Why Bitcoin’s $100K “Resistance” Is Artificial, Not Technical

$1.2B in gamma exposure mechanically suppresses Bitcoin rallies through automated dealer hedging strategies. Call walls at $100K and put floors at $90K trap Bitcoin
Share
LiveBitcoinNews2026/01/16 17:00