Ripple crypto (XRP/USDT): market stalls at equilibrium between bulls and bears

Price action is stuck in a delicate balance where neither bulls nor bears are in clear control, and Ripple crypto sits right in the middle of its recent range.
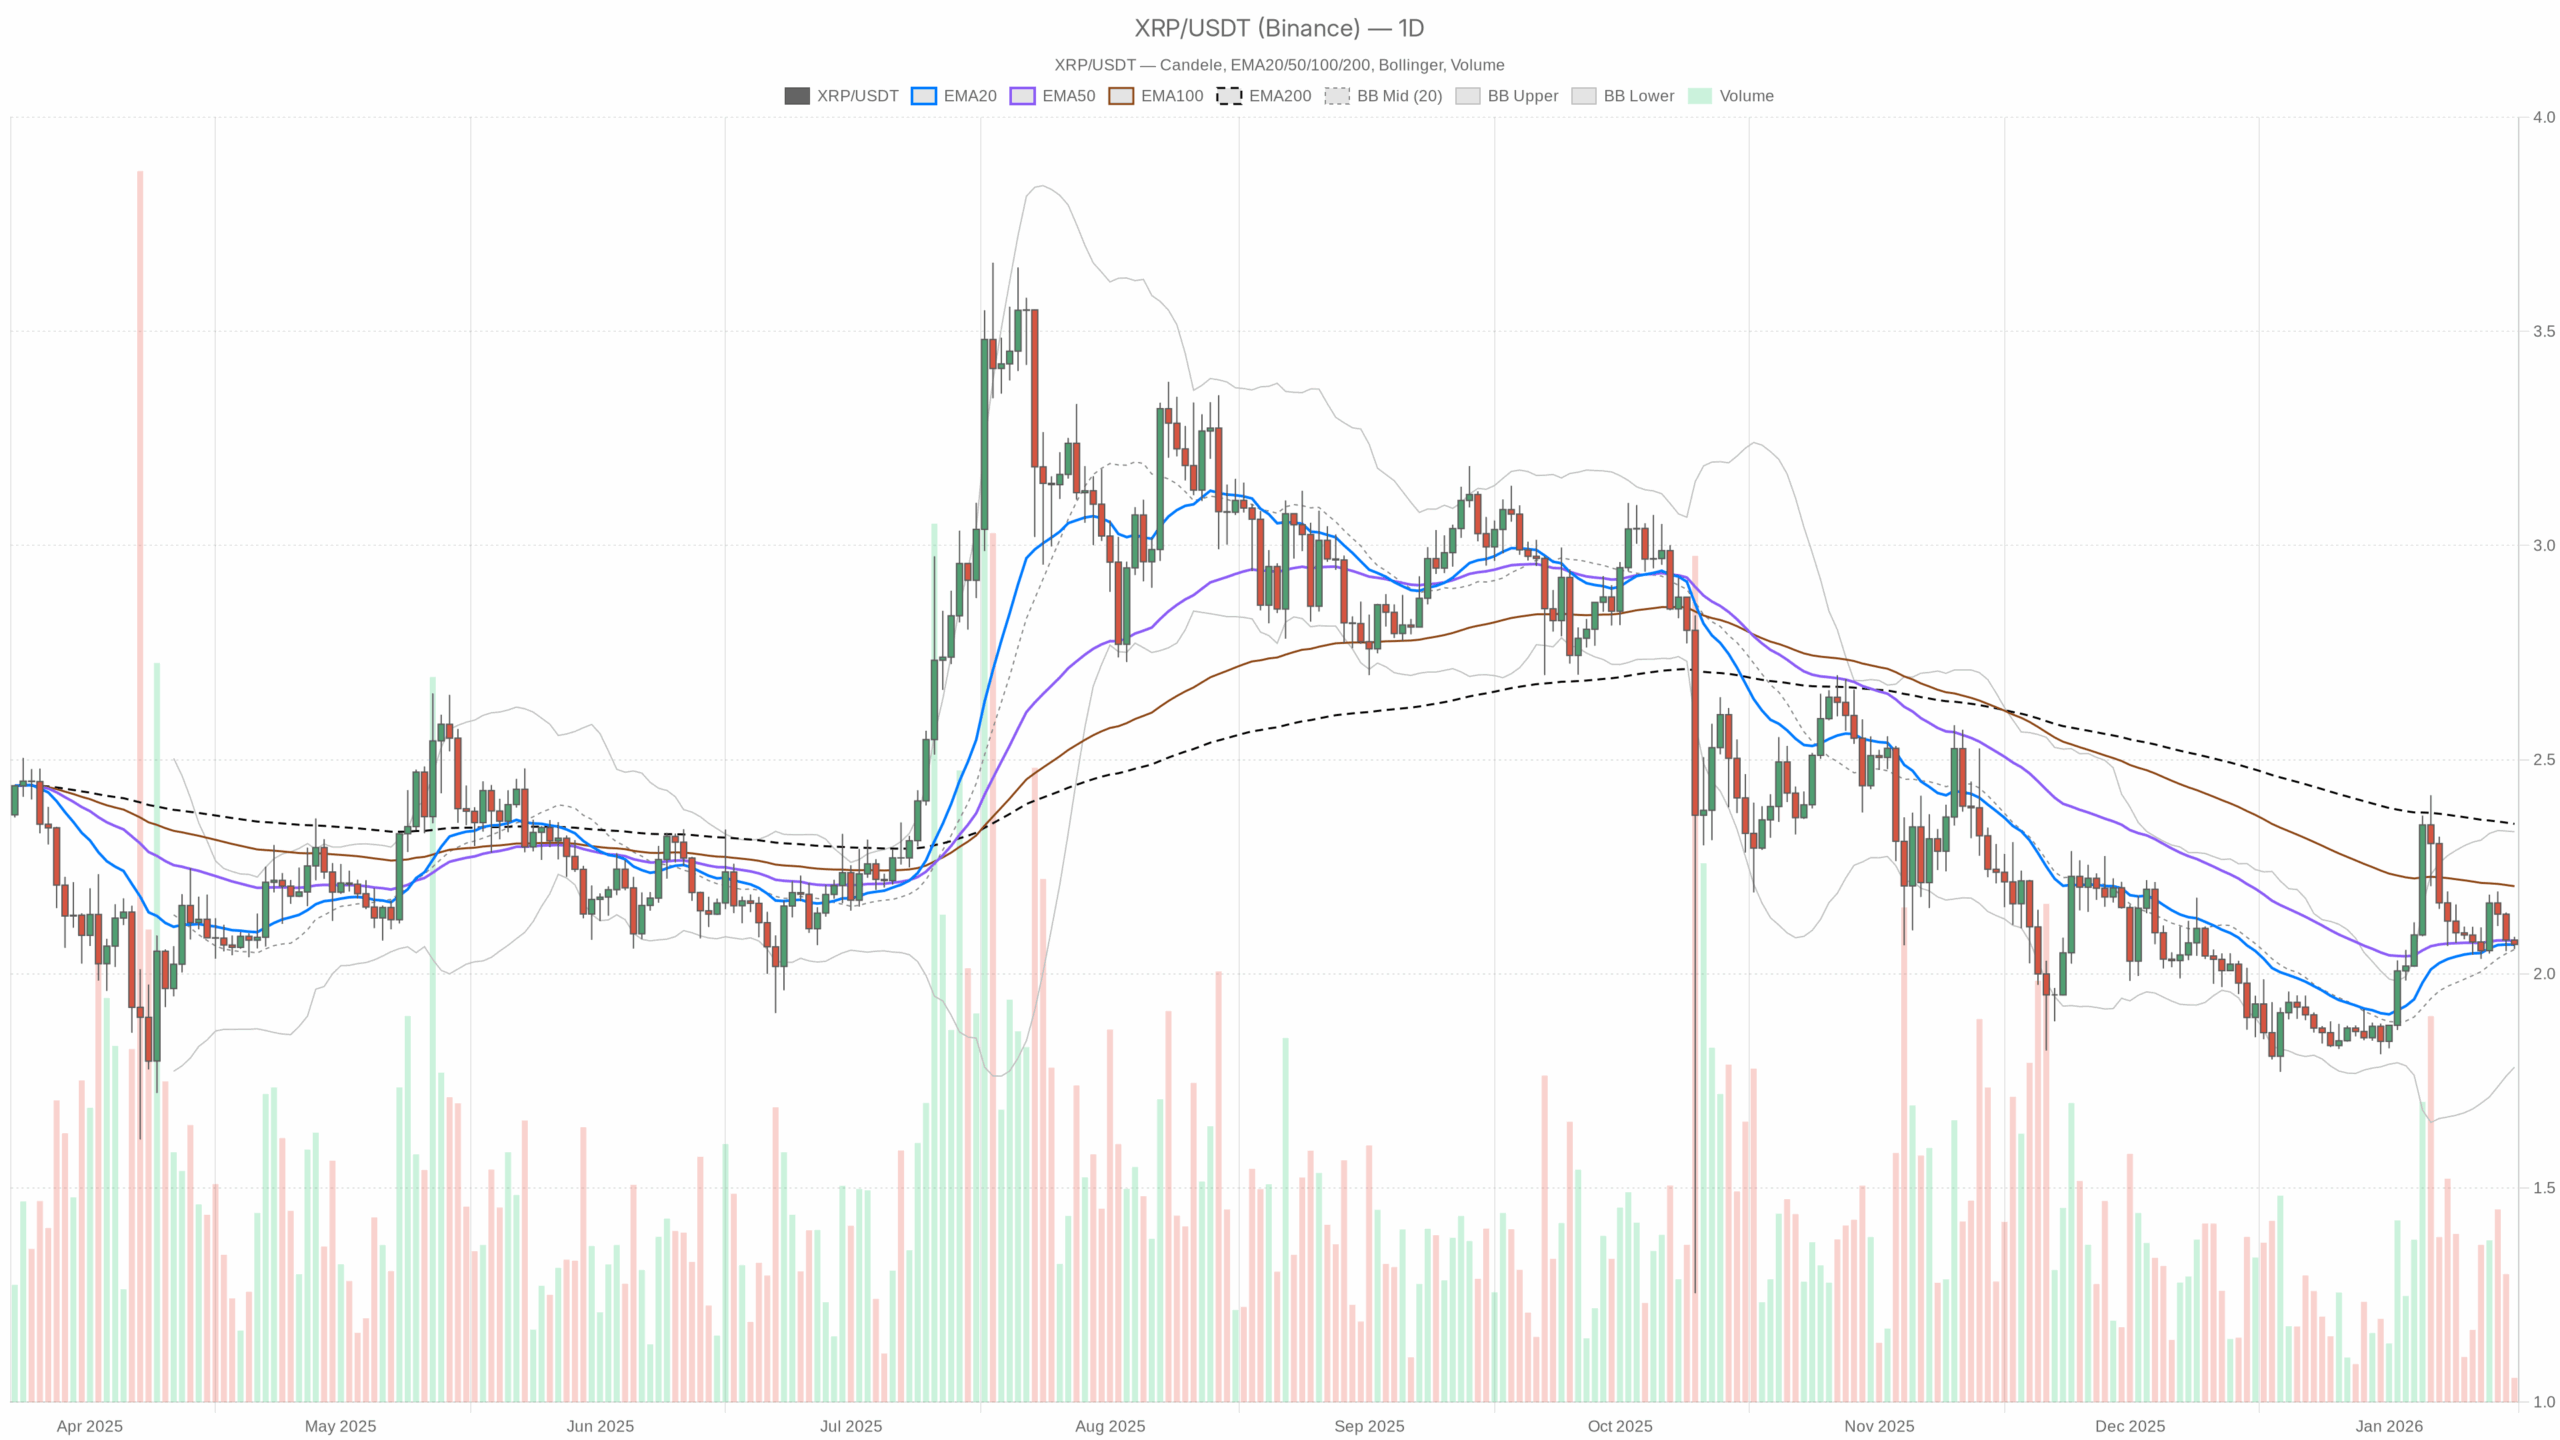 XRP/USDT — daily chart with candlesticks, EMA20/EMA50 and volume.
Main Scenario from Daily Chart: Neutral Bias with a Slight Downside Lean
The daily timeframe defines the macro bias, and right now it is best described as neutral with a slight downside tilt. Price is marginally below the 50-day EMA and well below the 200-day EMA, while short-term trend (20 EMA) and price are glued together. Moreover, momentum is flat and volatility bands leave room both ways.
Daily Trend Structure (EMA20 / EMA50 / EMA200)
– Price (close D1): $2.07
– EMA 20: $2.07
– EMA 50: $2.08
– EMA 200: $2.35
Price is exactly on the 20-day EMA and a cent under the 50-day EMA. That is a short-term equilibrium but slightly below the intermediate trend line. The real issue is the 200-day EMA all the way up at $2.35: XRP is trading meaningfully below its long-term trend, which keeps the larger structure in a corrective or post-rally digestion phase rather than a full-blown uptrend.
What this implies: In trend terms, Ripple crypto is in a consolidation pocket inside a broader, still-repairing structure. The short-term trend (20 EMA) has not broken down, but the long-term trend (200 EMA) is still above price and acting as an overhang. Bulls do not have trend dominance; they have, at best, short-term control inside a bigger sideways-to-lower environment.
Daily RSI (Momentum)
– RSI 14 (D1): 50.87
RSI parked around 51 is as middle-of-the-road as it gets. There is no overbought, no oversold, and no strong momentum impulse either way.
What this implies: The prior move has cooled off and the market is now in a wait-and-see mode. Momentum is neither fueling a fresh breakout nor signaling capitulation. This supports a mean-reversion or range-trading backdrop more than a trend-following one at this exact moment.
Daily MACD (Trend-Momentum Confirmation)
– MACD line: 0.03
– Signal line: 0.03
– Histogram: 0.00
MACD is literally flat: line and signal are on top of each other, histogram at zero.
What this implies: The market is in transition. There is no clear bullish or bearish momentum on the daily chart. This is exactly the kind of backdrop where the next impulsive move can break either way and will likely catch late traders leaning too hard in one direction.
Daily Bollinger Bands (Range & Volatility Context)
– Mid band: $2.06
– Upper band: $2.33
– Lower band: $1.78
– Close: $2.07 (essentially at mid band)
Price is sitting right on the mid band, with solid distance to both upper and lower bands.
What this implies: XRP is in the middle of its recent volatility envelope. There is breathing room for a move toward either $2.33 or $1.78 without the move being technically extreme. That reinforces the idea: this is a midpoint, not an edge of the range. The real opportunity usually appears closer to the bands, not at the center.
Daily ATR (Volatility)
– ATR 14 (D1): $0.11
With XRP around $2.07, a daily ATR of $0.11 means an average swing of roughly 5–6% per day.
What this implies: Volatility is present but not explosive. This is typical post-move digestion volatility: enough range to reward good entries, but not the kind of regime where moves of 20–30% in a single day are normal.
Daily Pivot Levels (Short-Term Reference)
– Pivot Point (PP): $2.07
– R1: $2.08
– S1: $2.06
Price is sitting exactly at the daily pivot, with R1 and S1 only one cent away on each side.
What this implies: On the daily, XRP is literally trading at its intraday equilibrium level. There is no clear directional bias from pivots; they are more useful as very local reference points for intraday traders than for macro bias right now.
Intraday Structure: Short-Term Pressure vs Daily Equilibrium
The shorter timeframes lean modestly bearish, which clashes with the neutral daily picture. However, the pressure is still controlled rather than aggressive.
1-Hour Chart (H1) – Mild Downtrend, Cooling Momentum
– Price (close H1): $2.07
– EMA 20: $2.08
– EMA 50: $2.09
– EMA 200: $2.11
– RSI 14: 39.56
– MACD: line -0.01, signal -0.01, histogram 0.00
– Bollinger mid: $2.08 (up $2.10, low $2.06)
– ATR 14 (H1): $0.01
– Pivot H1 (PP/R1/S1): $2.07 / $2.07 / $2.07
On H1, price is trading below all three EMAs (20, 50, 200). That is classic short-term downtrend structure: rallies into the EMAs are likely to be sold until proven otherwise. RSI around 40 shows mild bearish pressure, but not a washout. MACD is negative but flat, consistent with a gentle grind lower rather than a collapse.
What this implies: Intraday, XRPUSDT is being sold on strength, but the selling is controlled and not panic-driven. As long as price stays below the 200 EMA on H1 (around $2.11), the intraday bias remains against the bulls, even if the daily still looks neutral.
15-Minute Chart (M15) – Micro Noise in a Tight Band
– Price (close M15): $2.07
– EMA 20: $2.07
– EMA 50: $2.07
– EMA 200: $2.09
– RSI 14: 44.03
– MACD: line 0.00, signal 0.00, histogram 0.00
– Bollinger mid: $2.07 (up $2.08, low $2.06)
– ATR 14 (M15): ~0.00
– Pivot M15: PP $2.07 (R1/S1 also at $2.07)
The 15-minute is flatlining. EMAs are on top of each other, MACD has no pulse, ATR is basically zero at the moment, and price is churning inside a 1–2 cent band.
What this implies: Very short-term, XRP is in micro-consolidation. This kind of compression often precedes a volatility expansion, but direction is decided by which side of the nearby 1H structure breaks first, roughly below $2.06 or above $2.10–2.11.
Market Context: Risk Appetite is Muted
Total crypto market cap is down about 1.35% over the last 24 hours, and BTC dominance is high at around 57.5%. That is a classic setup where capital prefers the relative safety of Bitcoin over chasing altcoins. The Fear & Greed Index at 49 confirms a neutral risk mood, neither panic nor euphoria.
What this implies for Ripple crypto: The macro backdrop is not hostile, but it is not particularly supportive of aggressive altcoin upside either. For XRP to break meaningfully higher from here, it probably needs either a market-wide risk-on rotation out of BTC into majors, or a specific XRP-driven catalyst.
Scenarios for XRPUSDT
Bulish Scenario for Ripple Crypto
The bullish path assumes that the daily neutral structure resolves upward and the intraday downtrend gets squeezed.
Key steps bulls need:
1. Hold the $2.00–2.06 support area: This region is effectively the lower half of the current daily mid-range and close to the lower H1 Bollinger Band. A clean defense here would show that dip buyers are still active.
2. Reclaim intraday trend on H1: Price needs to regain the 20/50 EMA cluster around $2.08–2.09 and, more importantly, break and hold above the H1 200 EMA near $2.11. That would flip the short-term structure from sell rallies to buy dips.
3. Daily momentum turn: If RSI starts pushing into the high 50s or 60s and MACD ticks back into clearly positive territory, the daily will shift from neutral to bullish, with the upper Bollinger Band at $2.33 becoming a realistic magnet.
Upside potential in this scenario: First target is the upper daily band near $2.33, which also sits below the 200-day EMA at $2.35. That zone is a major test. If price can close decisively above the 200-day EMA, then the longer-term narrative for Ripple crypto changes from corrective to attempting a new uptrend, and a higher range opens up above $2.35.
What invalidates the bullish case: A sustained break and daily close below the $2.00 handle would weaken the argument that this is just a mid-range pause. If that happens while H1 RSI stays below 40 and price continues to respect the 200 EMA as resistance, bears will likely regain structural control.
Bearish Scenario for Ripple Crypto
The bearish path leans on the fact that intraday structure is already negative while the daily is merely neutral, leaving room for a downside resolution.
Key steps bears need:
1. Reject attempts above $2.08–2.10: As long as price is capped below the H1 EMA cluster and especially below $2.11 (H1 200 EMA), every bounce is just fuel for another leg down.
2. Push price away from the daily pivot: A clean move below $2.06, holding under the daily pivot at $2.07, would signal that the equilibrium is breaking lower.
3. Daily momentum deterioration: If daily RSI drifts into the low 40s and MACD flips more clearly negative, the neutral regime will start morphing into a proper downtrend. At that point, the lower daily Bollinger Band around $1.78 comes into play as a potential destination.
Downside potential in this scenario: The first obvious downside zone is the lower third of the current Bollinger envelope, roughly $1.90–1.80. A test of the lower band near $1.78 would not be extreme in volatility terms. A break and close below that would open the door to a deeper corrective leg, but for now the data only supports a move toward the band, not necessarily through it.
What invalidates the bearish case: If XRP can reclaim and hold above $2.11 on the 1H (clearing the 200 EMA) and then push daily closes toward $2.20 and above with RSI climbing, the intraday downtrend argument dies. At that point, bears lose their structural advantage and risk getting squeezed toward the upper daily band.
How to Think About Positioning and Risk
XRP is currently in a classic no man’s land on the daily chart: not cheap enough to scream value, not strong enough to justify chasing. Trend followers will see an asset still below its 200-day EMA; mean-reversion traders will see a mid-range price that does not offer great asymmetry either way.
The real battle is between the neutral daily and the bearish intraday structure. If you lean bullish on Ripple crypto, you want to see intraday selling pressure fade and the 1H trend flip. If you lean bearish, you want to see the daily neutrality finally crack and momentum drift lower.
Volatility is moderate, and with the wider crypto market in a neutral mood and BTC dominance high, surprises can come from either a macro shift in risk appetite or asset-specific news. In this kind of environment, position sizing and tolerance for whipsaw matter more than usual because markets stuck near equilibrium tend to punish overconfident leverage on both sides until a clear trend re-emerges.
If you want to monitor markets with professional charting tools and real-time data, you can open an account on Investing using our partner link:
Open your Investing.com account
This section contains a sponsored affiliate link. We may earn a commission at no additional cost to you.
Disclaimer: This analysis is for informational and educational purposes only and is not investment, financial, or trading advice. Cryptocurrency markets are highly volatile and you should do your own research and assess your risk carefully before making any trading decisions.
In summary, XRP sits at a technical crossroads with daily equilibrium and bearish intraday pressure, and the next break from this balance will likely define the next significant move.


You May Also Like

GOP lawmaker sues ex-wife who accused him of throwing boiling water on her
NVIDIA Stock Forecast as the US Clears H200 Chips Sales to China