

Dogecoin Price Drops 3.5% After Breaking Key $0.14 Support
This article was first published on The Bit Journal.
Dogecoin price fell 3.5% to $0.139 after a sharp break below the $0.14 level. Volume rose as the drop accelerated. That signaled strong sell-side pressure. It did not look like calm consolidation.
The move came as meme coin sentiment cooled. Traders continued to sell rebounds quickly. The broader crypto market stayed steadier. DOGE still underperformed during the session.
Selling intensified after support near $0.1420 failed. A fast slide followed. The market printed near $0.1393 close to the end of the session. Volume spiked during the final hour.
DOGE Rebound Holds Fibonacci Support as $0.1423 Becomes Pivot
A rebound later formed from $0.1362. That level aligns with major Fibonacci support. Buyers defended it strongly in earlier trading too. The bounce slowed momentum but did not flip it.
Resistance sits near $0.1423. This level lines up with moving average pressure. It now acts as a pivot zone for the next move.
Price action reflects a defensive market tone. Risk appetite is weaker across meme tokens. Liquidity also appears thinner in this segment. That makes breakdowns sharper.
Longer-term bullish narratives have still circulated. Some analysts have discussed inverse head-and-shoulders setups. Those patterns remain higher time frame ideas. Near-term demand has not matched the optimism.
Also Read: Dogecoin Forecast 2025–2026: Key Levels, and Analyst Predictions
For now, technical levels are driving decisions. Traders are watching support and resistance zones closely. Volatility compression may also lead to a bigger breakout soon.
Meme Coin Sentiment Cools Across the Market
Dogecoin price weakness followed a broader shift in sentiment. Meme tokens have struggled to sustain rallies. Traders appear less willing to chase upside. Many prefer quick entries and exits.
The lack of catalysts has added pressure. Markets often need new triggers to sustain a trend. Without that, rebounds are treated as sell points. DOGE has shown that behavior repeatedly.
Capital rotation is also visible. More flows have moved into assets with clearer institutional signals. Meme coins do not offer that same clarity. That has reduced dip-buying confidence.
Breakdown Structure Shows Lower Highs
A bearish structure formed before the breakdown. Lower highs capped rallies near $0.1450. Sellers controlled that level throughout the session. Each bounce failed earlier than the last one.
Support near $0.1420 acted as a key floor. Once it broke, selling accelerated. The token slipped toward $0.14 quickly. Buying interest appeared late.
| Month | Min. Price | Avg. Price | Max. Price | Change |
|---|---|---|---|---|
| Jan 2026 | $ 0.1344 | $ 0.1531 | $ 0.1781 |
27.37%
|
| Feb 2026 | $ 0.1480 | $ 0.1601 | $ 0.1725 |
23.35%
|
| Mar 2026 | $ 0.1518 | $ 0.1645 | $ 0.1702 |
21.68%
|
| Apr 2026 | $ 0.1546 | $ 0.1728 | $ 0.1984 |
41.85%
|
| May 2026 | $ 0.1463 | $ 0.1514 | $ 0.1560 |
11.56%
|
| Jun 2026 | $ 0.1420 | $ 0.1491 | $ 0.1572 |
12.41%
|
| Jul 2026 | $ 0.1440 | $ 0.1474 | $ 0.1584 |
13.29%
|
| Aug 2026 | $ 0.1696 | $ 0.2450 | $ 0.3193 |
128.32%
|
| Sep 2026 | $ 0.1813 | $ 0.2126 | $ 0.2440 |
74.46%
|
| Oct 2026 | $ 0.1761 | $ 0.2078 | $ 0.2425 |
73.43%
|
| Nov 2026 | $ 0.1668 | $ 0.1754 | $ 0.1857 |
32.81%
|
| Dec 2026 | $ 0.1887 | $ 0.1986 | $ 0.2060 |
47.27%
|
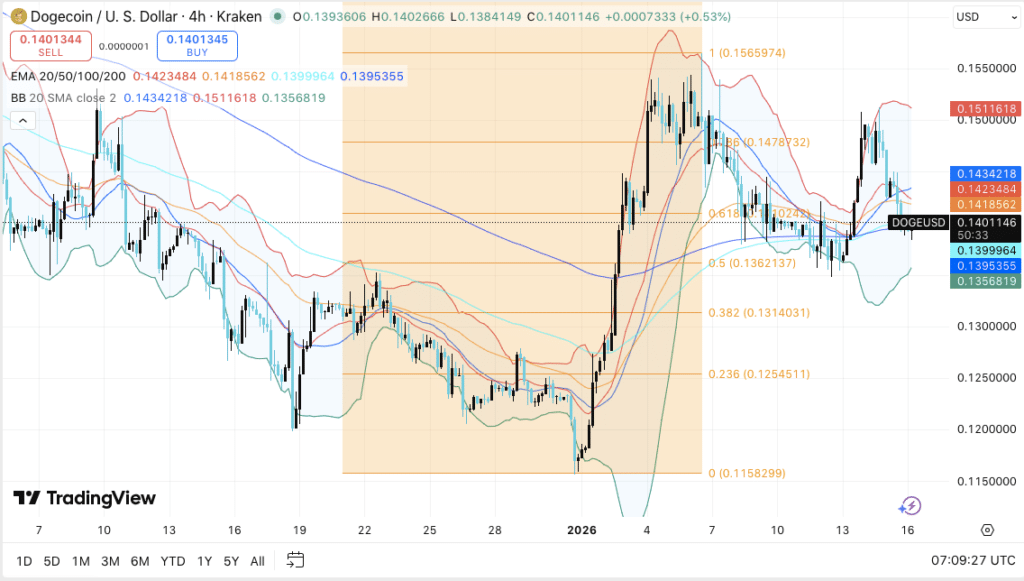
A brief rebound later stalled around $0.1402. That level attracted new supply. Price rolled over again and headed lower. The final volume spike near the close added weight to bearish pressure.
Key Support Zones
Immediate support cluster sits at $0.1395 Moving averages overlap here. This can help form a base. It can also break quickly if panic selling returns.
If the market loses $0.140, attention shifts to $0.1362. That Fibonacci zone already triggered a rebound. A retest could attract bids again.
If $0.1362 fails, the structure weakens. The next downside level is near $0.1314. Below that sits $0.1254. A larger bearish continuation would become clearer under $0.1158.
Resistance Levels and Bull Targets
The first resistance is $0.1423. This area matches moving average pressure. It remains the key pivot for bulls. A clean reclaim would improve the rebound structure.
If the market moves above $0.1423, the next barrier is $0.1479. This Fibonacci resistance often draws sellers. It becomes a major checkpoint during early recovery rallies.
Above that sits $0.1512. This level marks the range ceiling. It also aligns with the upper Bollinger Band. A breakout above $0.1512 could open the path toward $0.1566.
Bollinger Bands Signal a Possible Breakout
Volatility expanded during the decline. Bollinger Bands widened as the drop accelerated. This is common in sharp selloffs. It reflects rising price swings.
Bands later began tightening as price stabilized. That suggests compression. Compression phases often end with a breakout. The move can go in either direction.
 Source: TradingView
A push above resistance could trigger a stronger rebound. A break under support could restart the selloff. Traders may wait for confirmation before taking larger risk.
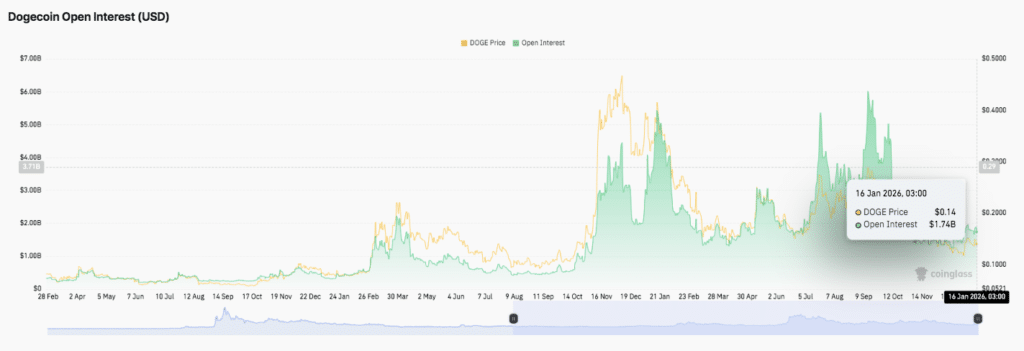
Open Interest and Spot Flows Add Context
Derivative data shows a reset in leverage. Open interest surged during the late-year rally. It then fell sharply as positions closed. The market now looks more balanced.
Open interest has stabilized near $1.74 billion. This has happened as the token trades around $0.14. It suggests traders are rebuilding exposure. It does not show aggressive leverage yet.
 Source: CoinGlass
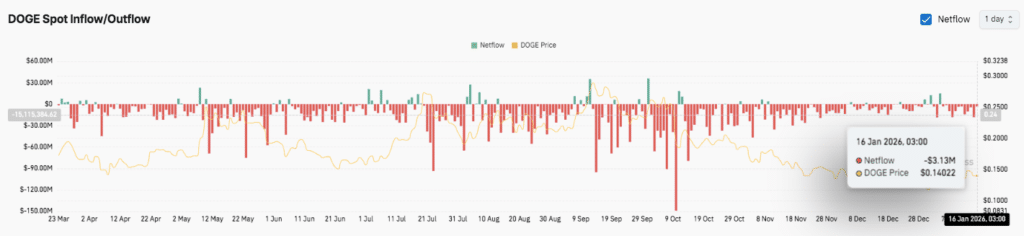
Spot flows remain slightly bearish. Net outflows are still the main trend. Inflows appear at times but fade quickly. The latest netflow reading near $3.13 million signals mild outflows.
 Source: CoinGlass
Conclusion
Dogecoin price fell below $0.14 after sellers broke key support with strong volume. A bounce from $0.1362 helped stabilize the chart. Resistance near $0.1423 still caps upside momentum.
Volatility is compressing again. That raises breakout risk. Support at $0.1401 and $0.1362 remains crucial for bulls. Upside targets include $0.1479, $0.1512, and $0.1566.
Also Read: Dogecoin Price Forecast: Whales Scoop Up 4.7B DOGE as Double Bottom Signals Big Reversal
Appendix Glossary of Key Terms
Psychological Support: A round price at which traders expect to buy.
Fibonacci Support: A pullback area where buyers tend to materialize following a retracement.
Pivot Zone: An area of price that can turn momentum bearish or bullish.
Moving Average Resistance: It is a dynamic resistance barrier and can be adjusted according to MAs/ EMAs values, trapping the rallies.
Bollinger Band Contraction: The opposite of Expansion; tight bands that often precede a breakout.
Volatility Expansion: A period when large price swings begin rapidly occurring after a period of consolidation.
Lower Highs: A bearish system indicating that sellers are in charge of pullbacks.
Open Interest (OI): The overall number of contracts being traded.
Frequently Asked Questions About Dogecoin price
1- Why did the Dogecoin price fall below $0.14?
Selling pressure increased after support failed. Volume rose during the drop, suggesting liquidation-style flows.
2- What is the strongest support level now?
Immediate support is $0.1401. The next major level is $0.1362 if $0.140 breaks.
3- What resistance must bulls reclaim?
The key pivot is $0.1423. Above it, resistance sits at $0.1479 and $0.1512.
4- Is volatility likely to rise again?
Yes. Bollinger Bands are tightening, which often precedes a sharp breakout move.
References
CoinDesk
CoinEdition
Read More: Dogecoin Price Drops 3.5% After Breaking Key $0.14 Support">Dogecoin Price Drops 3.5% After Breaking Key $0.14 Support


You May Also Like

Iran’s army chief warns of ‘total destruction’ for ground invasion

SHIB and Pi Move Sideways, BlockDAG Takes the Market Lead With a Live Casino and Utility Stack! Is It the Best Crypto to Buy Now?


