Bitcoin ETFs See $1.4 Billion Inflows as Buy Signal Appears This Week
TLDR
- Bitcoin ETFs recorded $1.42B inflows this week, the highest since October 2025.
- Pi Cycle Top Indicator shows market is not overheated, signaling potential upside.
- BTC holds above $95,000 despite recent bearish pressure and low momentum.
- ETF inflows show rising institutional interest amid cautious trading conditions.
Spot Bitcoin ETFs saw weekly inflows of $1.42 billion, according to recent data. This is the highest total recorded since October 2025, when inflows reached $2.71 billion. The increased capital entering Bitcoin ETFs signals rising investor confidence during a time of cautious trading.
Analysts say that ETF inflows usually suggest longer-term positions rather than short-term speculation. The strong demand this week has come despite limited price movement in the broader market, indicating growing interest from institutional investors.
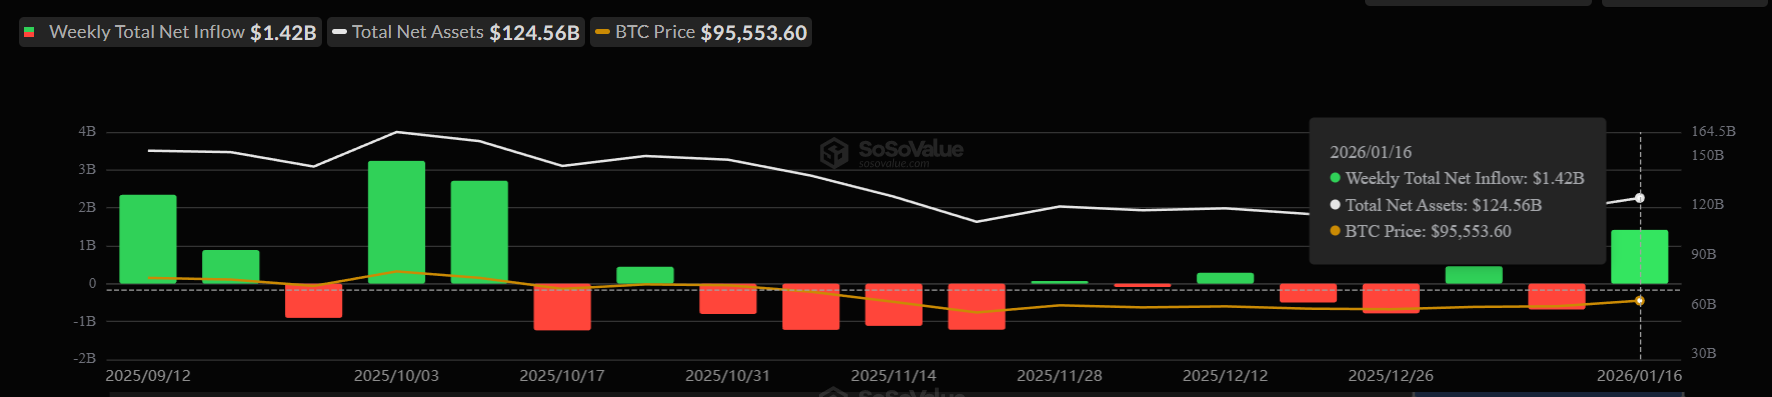
Source: Sosovalue
Bitcoin spot ETFs continue to attract attention from traditional finance participants. The ongoing interest may support BTC’s price stability and could provide momentum for upward movement if market conditions stay supportive.
Buy Signal Appears From Pi Cycle Indicator
The Pi Cycle Top Indicator, which compares the 111-day simple moving average and the 2×365-day moving average, has shown a divergence. This divergence means the two lines are moving apart, which in past cycles has pointed to non-overheated market conditions.
A wider gap between these averages has often coincided with early-to-mid bull market phases. According to historical patterns, when the Pi Cycle Top Indicator diverges rather than converges, the market tends to be in a healthier position for price growth.
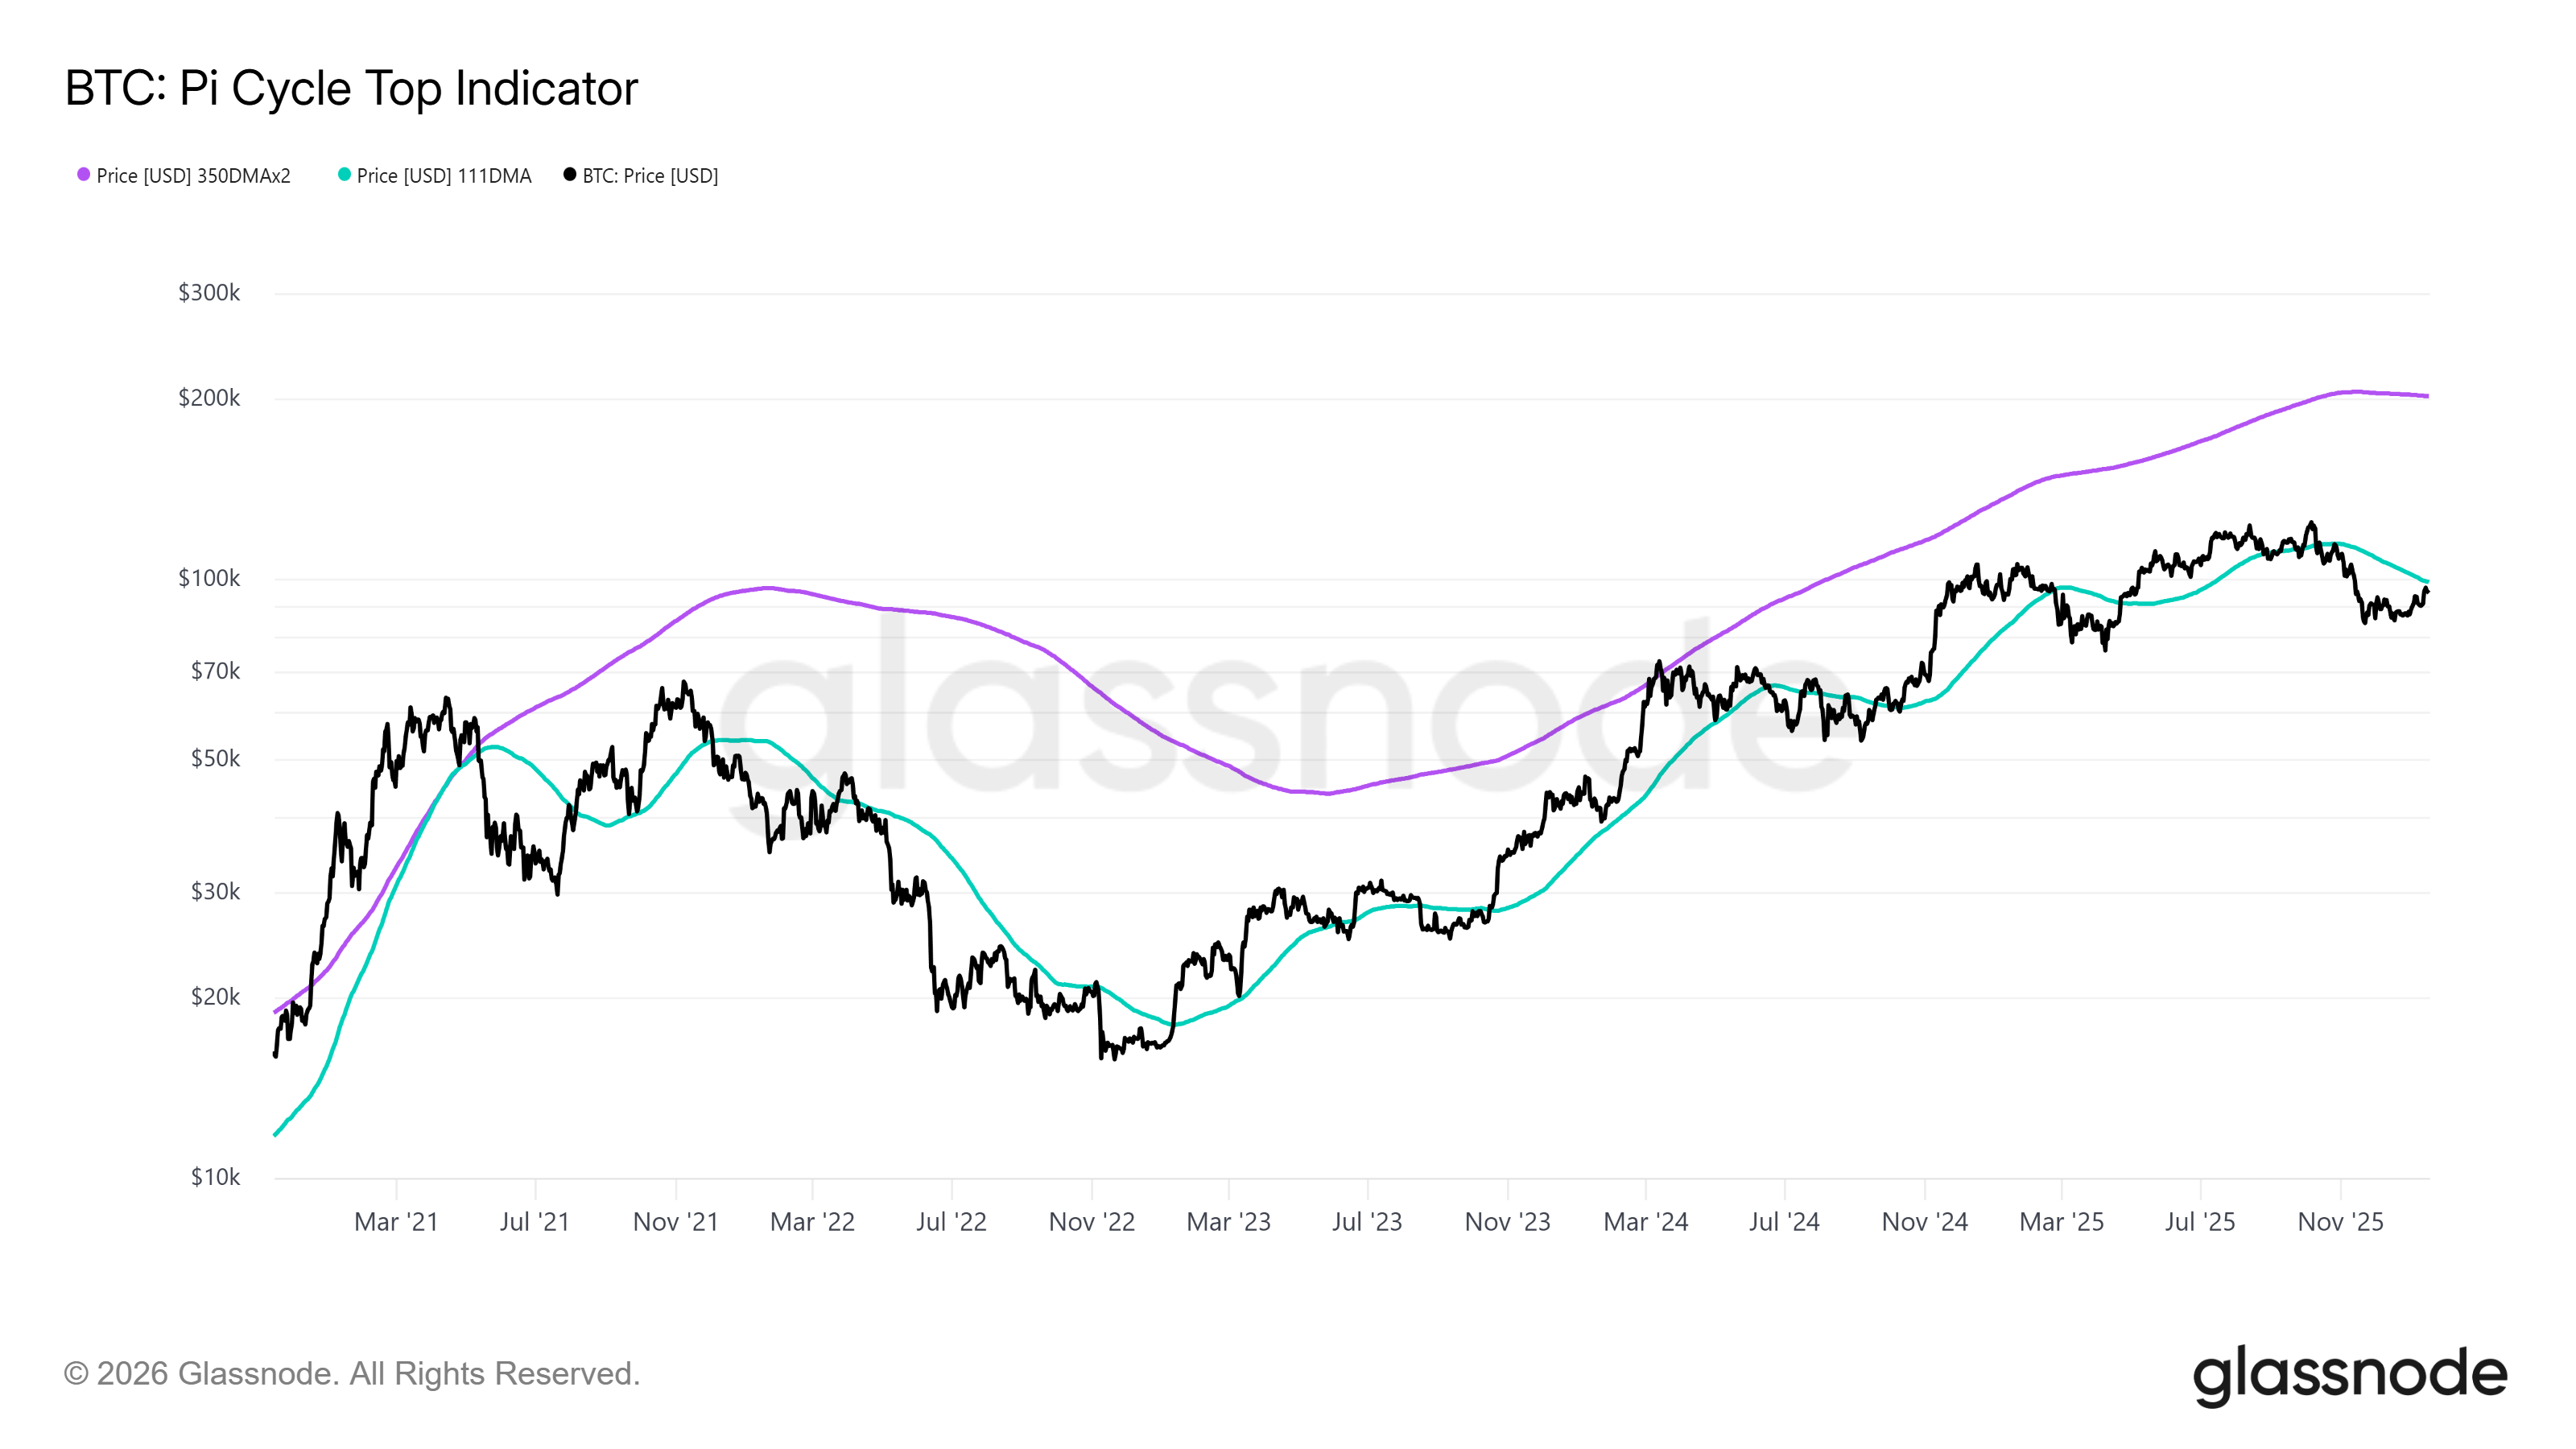
Source: Glassnode
This setup contrasts with previous market tops when the two moving averages crossed, which often marked major price corrections. Analysts believe the current divergence offers a supportive signal for bulls in the near term.
Bitcoin Price Holds Key Support Level
Bitcoin’s price remains stable above the $95,000 support level, currently trading near $95,173. This level has been tested multiple times over recent sessions, yet buying interest has helped maintain price stability. Traders continue to monitor this zone closely, as holding this level may lead to a fresh rally.
If upward pressure builds, Bitcoin could target $98,000 and eventually move toward the $100,000 psychological resistance. Reclaiming the 200-day exponential moving average near $95,986 could also restore market confidence and support further gains.

However, a breakdown below $95,000 could shift momentum in the other direction. If support fails, BTC may slide toward $93,471, where the next key level lies.
Market Sentiment Remains Mixed Despite Institutional Demand
Although ETF inflows have grown, general market sentiment remains cautious due to global economic uncertainties. Bitcoin has faced mild bearish pressure recently, and many traders are avoiding aggressive moves.
The rising ETF flows offer some optimism. Still, any reversal in demand or increased selling pressure could weaken the current setup. For now, institutional buying remains strong, and key indicators do not suggest overbought conditions.
The coming weeks may offer clarity, especially if inflows continue and BTC maintains support above $95,000. Price action near this level will be closely watched by traders and analysts.
The post Bitcoin ETFs See $1.4 Billion Inflows as Buy Signal Appears This Week appeared first on CoinCentral.


You May Also Like

Will Altcoins Hit 100x in 2026?

Why Is $ONDO Growing Fast While Ondo Price Stays Broken?