

Silver Hits New All Time High Near $95 as Bulls Target $100 on Supply Deficit and Industrial Demand
Silver hit a new all time high on Tuesday, with spot prices reaching about $95 an ounce, according to market data tracking XAG.
Charts showed silver trading near $95.23 at the peak, after a steep climb that accelerated into January. The move lifted silver’s 24 hour range to roughly $92.45 to $95.30 and set the latest record near $95.30.
Silver Price 7D Chart. Source: CoinCodex
The rally followed months of gradual gains through 2025, after silver spent much of the year holding in the $30 to $40 zone. Momentum tightened near the top as prices stayed close to the new high during the session.
Market metrics on the same data feed listed silver’s market cap near $17.85 trillion and volatility around 9.56%, while the sentiment indicator read bullish.
Silver’s previous cycle low sat near $11.69 in March 2020. The 52 week low was listed near $28.49, highlighting how far the metal has moved before breaking into record territory.
Silver Nears $100 as Supply Deficit and Industrial Demand Fuel Squeeze Talk
Silver climbed toward the $100 mark as prices extended a steep rally, prompting renewed debate over whether the metal is entering a sustained squeeze driven by supply constraints and rising industrial demand.
Spot silver traded near record levels after months of steady gains, with charts showing a sharp acceleration since late 2025. The move followed silver’s break above long-term resistance, as price action shifted from gradual advances to near-vertical gains on daily charts.
Market commentary circulating on X framed the rally as more than a speculative surge. Analysts pointed to industrial consumption as a central factor, noting that silver demand from solar panel manufacturing has doubled over the past three years. At the same time, expanding data centers linked to artificial intelligence and growing electric vehicle production have increased silver use across electronics and power systems. These trends have reshaped silver’s role from a traditional monetary metal to a key industrial input.
Supply dynamics added further pressure. Global silver output has remained in deficit for five straight years, according to industry estimates, as mine production failed to keep pace with consumption. Above-ground inventories tracked by major exchanges have declined during that period, tightening the physical market even as paper trading volumes remain high.
Relative valuation trends also supported the bullish case. Gold recently set fresh all-time highs, while the gold-to-silver ratio stayed elevated compared with historical norms. Market data showed that previous periods of stretched ratios often preceded phases in which silver outperformed gold, as capital rotated into the cheaper metal.
Price charts reflected those conditions, with silver pushing higher through late 2025 and entering 2026 near the upper end of its recent range. TradingView data showed consecutive higher highs and limited pullbacks, signaling strong demand at rising prices.
Together, rising industrial use, persistent supply deficits, and shifting relative valuations have reinforced expectations that silver could test the $100 level if current conditions persist. Whether prices stabilize near record territory or extend gains further now depends on how quickly supply responds and whether demand remains elevated as the rally matures.


You May Also Like
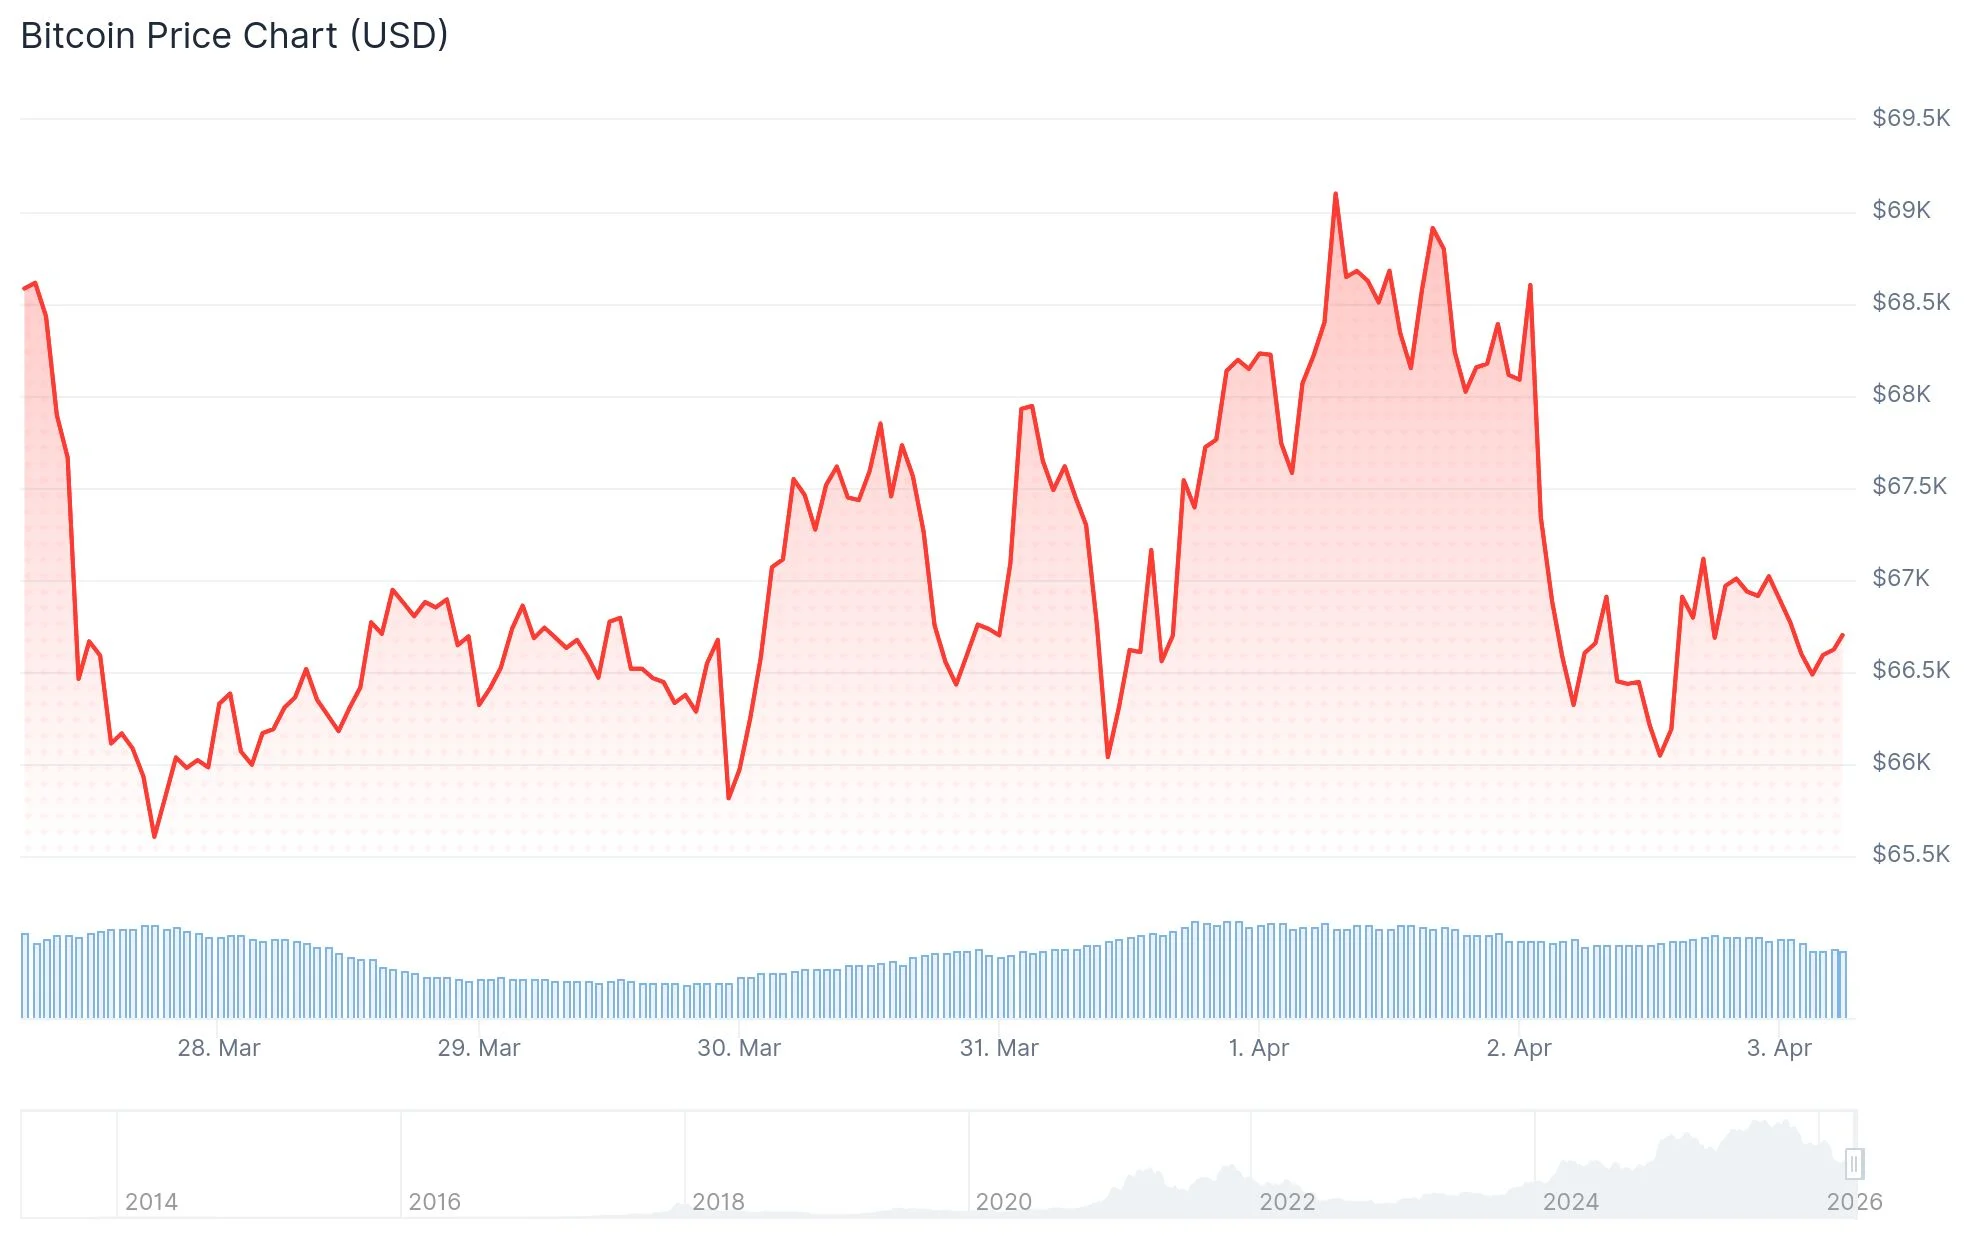
Bitcoin (BTC) Dips Below $67K as Markets Enter Easter Break While Oil Hits 11% Single-Day Surge

Trump's revenge tour will come back to bite him in the you-know-what
Ethereum price today $2,130 — bearish below $2,150; $2,116 key


