Bitcoin price started a fresh decline below $90,000. BTC is consolidating losses and remains at risk of more losses if it dips below $88,000. Bitcoin started a Bitcoin price started a fresh decline below $90,000. BTC is consolidating losses and remains at risk of more losses if it dips below $88,000. Bitcoin started a

Bitcoin Price Loses $90K, Traders Brace for a Volatile Next Move

2026/01/21 10:54

Bitcoin price started a fresh decline below $90,000. BTC is consolidating losses and remains at risk of more losses if it dips below $88,000.

  • Bitcoin started a sharp decline below $92,000 and $90,000.
  • The price is trading below $90,000 and the 100 hourly Simple moving average.
  • There is a bearish trend line forming with resistance at $94,200 on the hourly chart of the BTC/USD pair (data feed from Kraken).
  • The pair might continue to move down if it stays below the $92,000 zone.

Bitcoin Price Dips 5%

Bitcoin price failed to stay above the $92,500 support and started a fresh decline. BTC declined sharply below the $91,000 and $90,500 support levels.

The bears even pushed the price below $90,000. A low was formed at $87,784, and the price is now consolidating losses. There was a minor recovery wave above $88,500, but the price stayed below the 23.6% Fib retracement level of the recent decline from the $95,475 swing high to the $87,784 low.

Bitcoin is now trading below $90,000 and the 100 hourly Simple moving average. If the price remains stable above $88,000, it could attempt a fresh increase. Immediate resistance is near the $89,600 level. The first key resistance is near the $90,000 level.

The next resistance could be $91,650 or the 50% Fib retracement level of the recent decline from the $95,475 swing high to the $87,784 low. A close above the $91,650 resistance might send the price further higher. In the stated case, the price could rise and test the $92,000 resistance.

Bitcoin Price

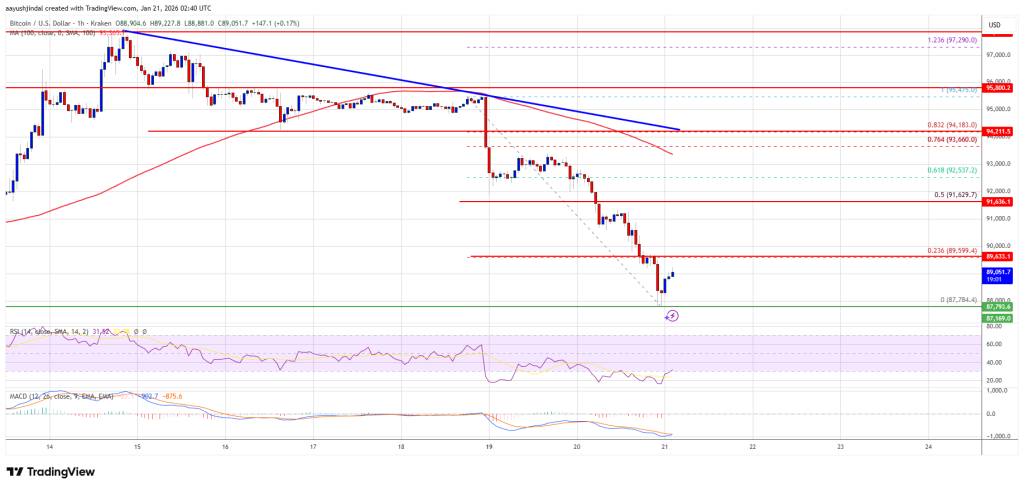
Any more gains might send the price toward the $94,000 level. There is also a bearish trend line forming with resistance at $94,200 on the hourly chart of the BTC/USD pair. The next barrier for the bulls could be $95,000 and $95,500.

More Losses In BTC?

If Bitcoin fails to rise above the $91,650 resistance zone, it could start another decline. Immediate support is near the $88,800 level. The first major support is near the $88,000 level.

The next support is now near the $87,500 zone. Any more losses might send the price toward the $86,200 support in the near term. The main support sits at $85,000, below which BTC might accelerate lower in the near term.

Technical indicators:

Hourly MACD – The MACD is now gaining pace in the bearish zone.

Hourly RSI (Relative Strength Index) – The RSI for BTC/USD is now below the 50 level.

Major Support Levels – $88,800, followed by $88,000.

Major Resistance Levels – $91,650 and $92,000.

Market Opportunity
Bitcoin Logo
Bitcoin Price(BTC)
$89,581.09
$89,581.09$89,581.09
-1.21%
USD
Bitcoin (BTC) Live Price Chart
Disclaimer: The articles reposted on this site are sourced from public platforms and are provided for informational purposes only. They do not necessarily reflect the views of MEXC. All rights remain with the original authors. If you believe any content infringes on third-party rights, please contact service@support.mexc.com for removal. MEXC makes no guarantees regarding the accuracy, completeness, or timeliness of the content and is not responsible for any actions taken based on the information provided. The content does not constitute financial, legal, or other professional advice, nor should it be considered a recommendation or endorsement by MEXC.

You May Also Like

What Does Smart Money Accumulation Mean for Bitcoin’s Price?

What Does Smart Money Accumulation Mean for Bitcoin’s Price?

The post What Does Smart Money Accumulation Mean for Bitcoin’s Price? appeared on BitcoinEthereumNews.com. Bitcoin (BTC) whales and shark holders have continued
Share
BitcoinEthereumNews2026/01/21 13:11
Silver rally strains global supply as retail demand surges across Asia

Silver rally strains global supply as retail demand surges across Asia

Silver’s rapid price surge is rippling through global markets, straining supply chains and forcing banks and refiners to scramble to meet unprecedented retail demand
Share
Coinstats2026/01/21 12:52
Cryptos Signal Divergence Ahead of Fed Rate Decision

Cryptos Signal Divergence Ahead of Fed Rate Decision

The post Cryptos Signal Divergence Ahead of Fed Rate Decision appeared on BitcoinEthereumNews.com. Crypto assets send conflicting signals ahead of the Federal Reserve’s September rate decision. On-chain data reveals a clear decrease in Bitcoin and Ethereum flowing into centralized exchanges, but a sharp increase in altcoin inflows. The findings come from a Tuesday report by CryptoQuant, an on-chain data platform. The firm’s data shows a stark divergence in coin volume, which has been observed in movements onto centralized exchanges over the past few weeks. Bitcoin and Ethereum Inflows Drop to Multi-Month Lows Sponsored Sponsored Bitcoin has seen a dramatic drop in exchange inflows, with the 7-day moving average plummeting to 25,000 BTC, its lowest level in over a year. The average deposit per transaction has fallen to 0.57 BTC as of September. This suggests that smaller retail investors, rather than large-scale whales, are responsible for the recent cash-outs. Ethereum is showing a similar trend, with its daily exchange inflows decreasing to a two-month low. CryptoQuant reported that the 7-day moving average for ETH deposits on exchanges is around 783,000 ETH, the lowest in two months. Other Altcoins See Renewed Selling Pressure In contrast, other altcoin deposit activity on exchanges has surged. The number of altcoin deposit transactions on centralized exchanges was quite steady in May and June of this year, maintaining a 7-day moving average of about 20,000 to 30,000. Recently, however, that figure has jumped to 55,000 transactions. Altcoins: Exchange Inflow Transaction Count. Source: CryptoQuant CryptoQuant projects that altcoins, given their increased inflow activity, could face relatively higher selling pressure compared to BTC and ETH. Meanwhile, the balance of stablecoins on exchanges—a key indicator of potential buying pressure—has increased significantly. The report notes that the exchange USDT balance, around $273 million in April, grew to $379 million by August 31, marking a new yearly high. CryptoQuant interprets this surge as a reflection of…
Share
BitcoinEthereumNews2025/09/18 01:01