Ethereum price under pressure: where the ETHUSDT downtrend can break — and where it can accelerate

ETH is still trading defensively, with the Ethereum price sitting around $2,970, pinned near the lower Bollinger Band on the daily chart and below every key moving average.
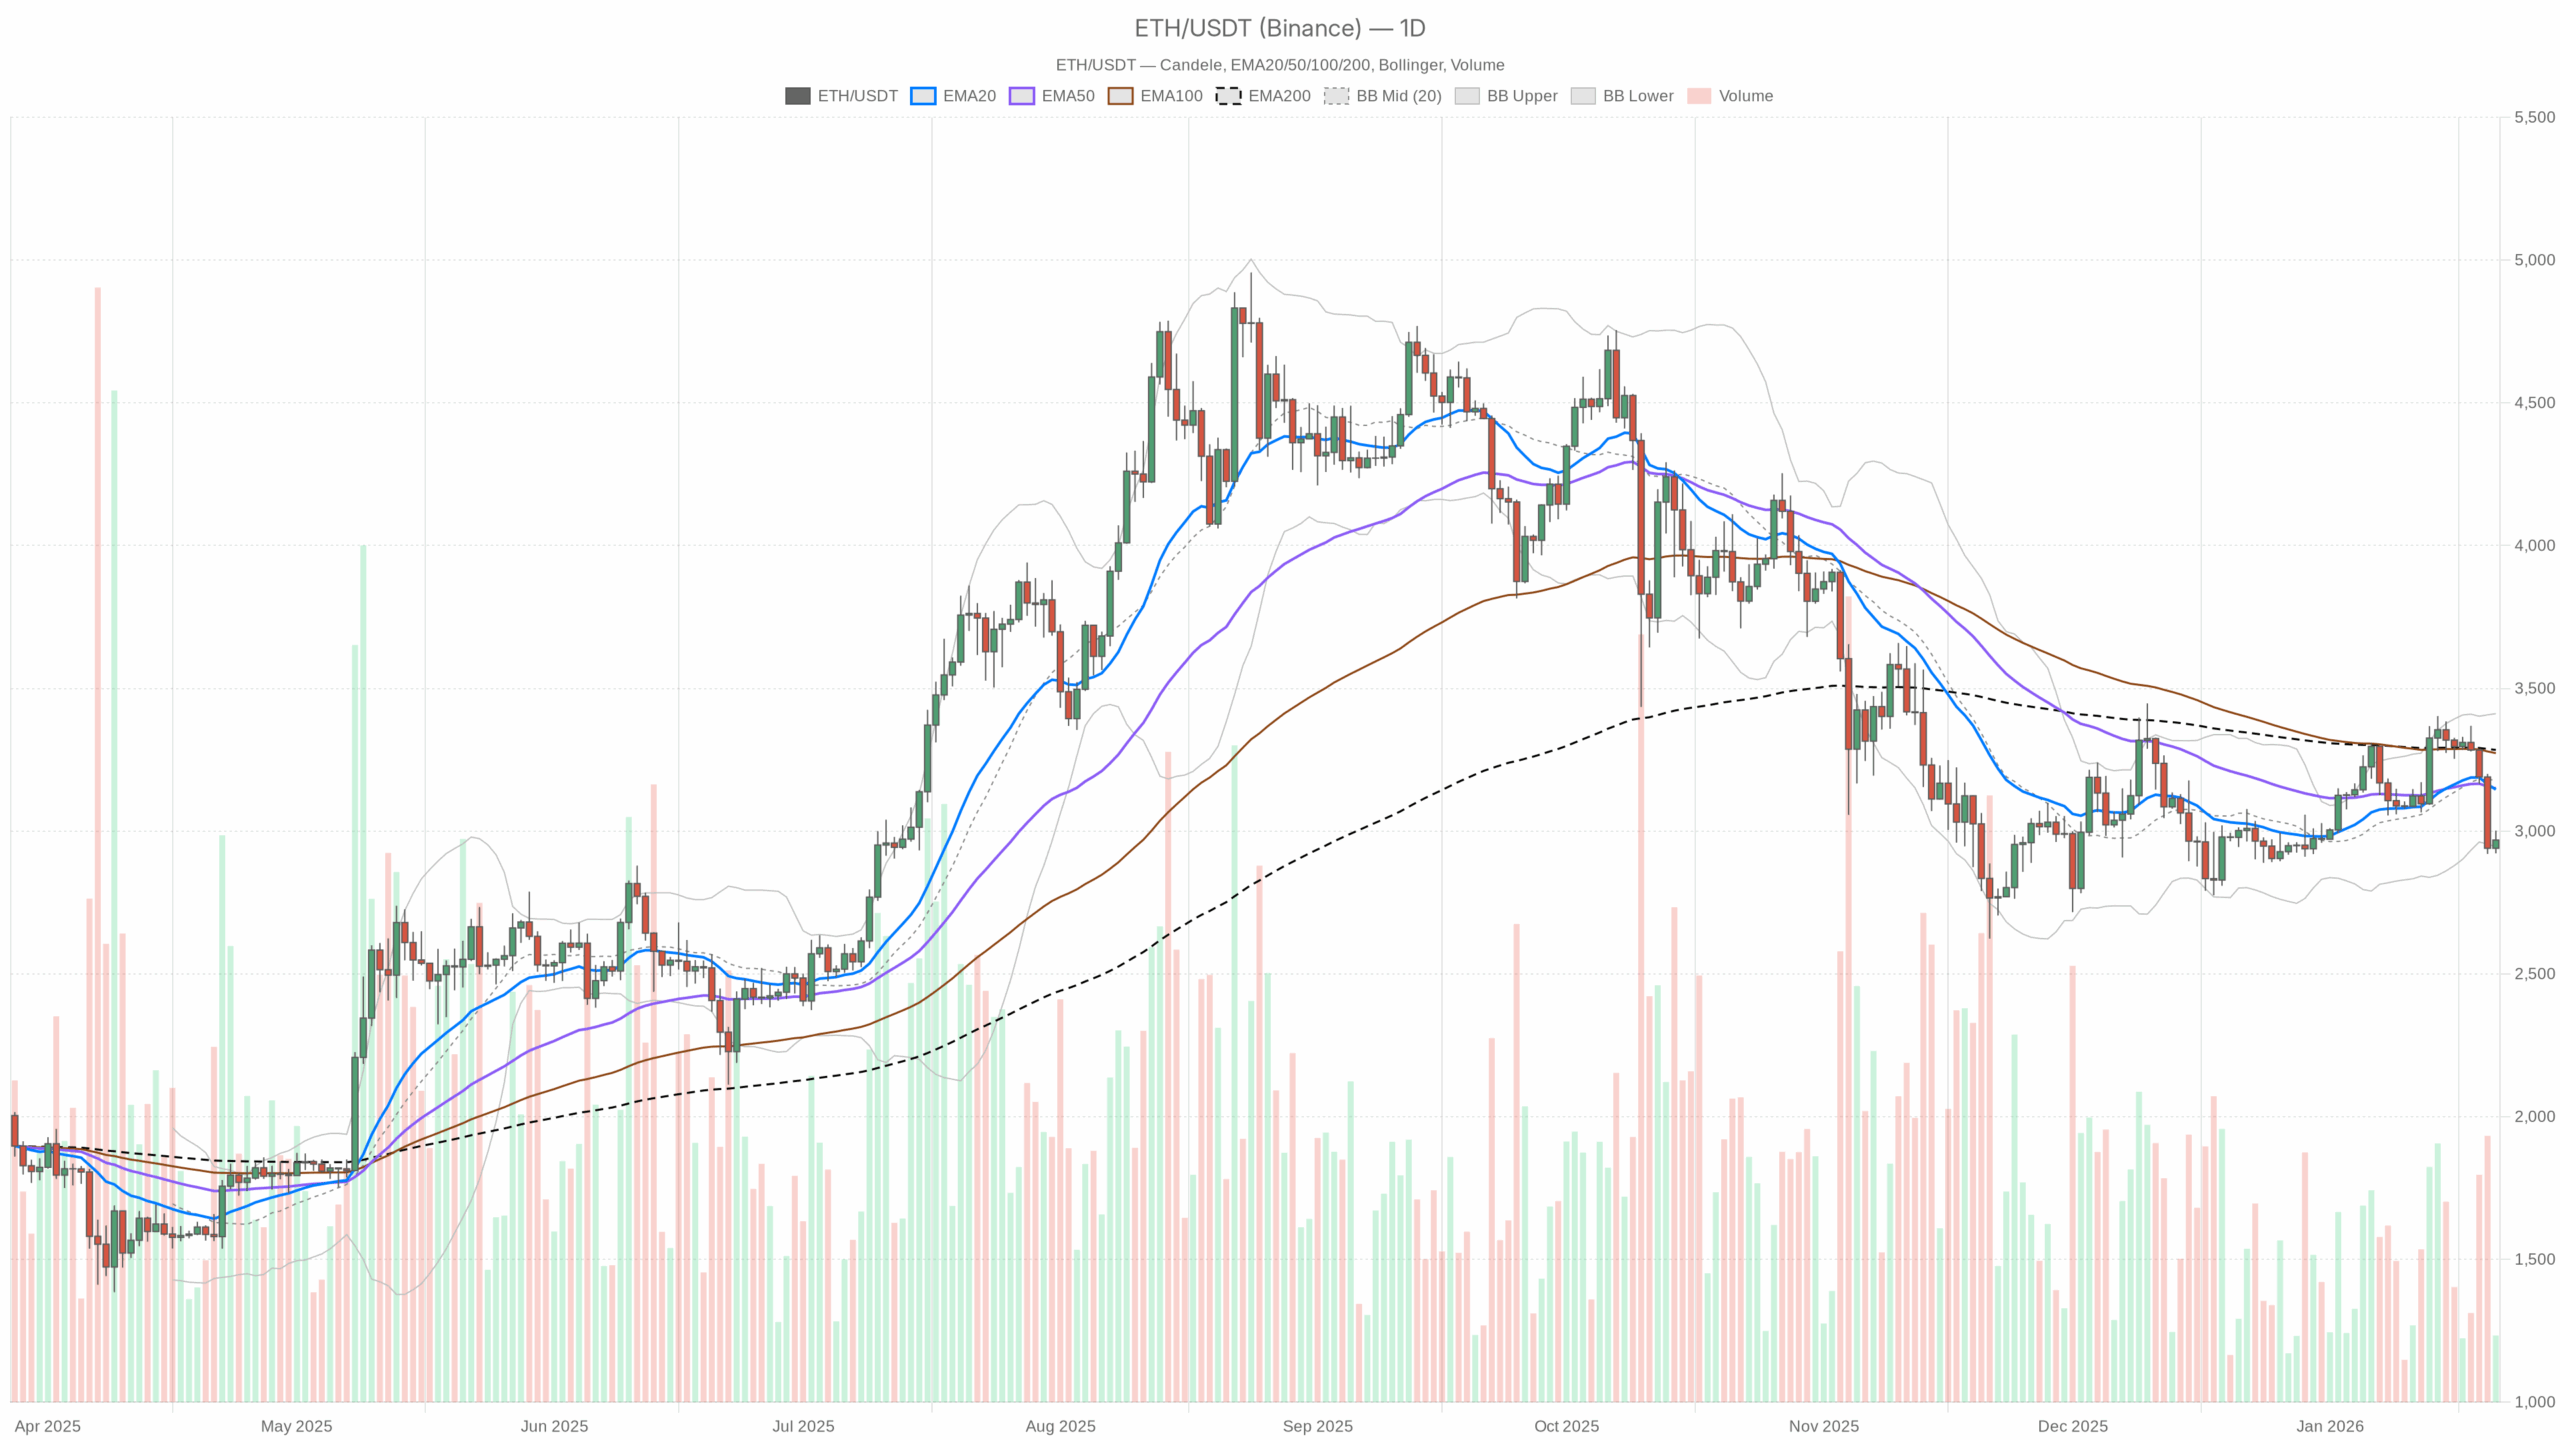 ETH/USDT — daily chart with candlesticks, EMA20/EMA50 and volume.
Main scenario from the daily chart: still bearish, but nearing a decision point
The daily timeframe is clearly bearish for ETHUSDT and defines the main scenario. This is not a market in balance; sellers have had the upper hand, and dip buyers are only just beginning to show up intraday.
Daily trend and EMAs
Price: $2,968.65
EMA20: $3,145.61 | EMA50: $3,149.67 | EMA200: $3,284.50
Price is decisively below the 20, 50, and 200-day EMAs, and those shorter EMAs have rolled over under the 200-day. That is a classic downtrend structure: rallies are being sold, not followed through.
Human read: as long as ETH sits under roughly $3,150–3,200, the market is treating bounces as opportunities to reduce risk, not start a new bull leg.
Daily RSI
RSI(14) daily: 39.87
RSI is below 50 but not yet deeply oversold. Momentum is negative but not capitulatory.
Human read: bears are in control, but this is more a grind lower than a flush. There is still room for another leg down before classic oversold exhaustion kicks in.
Daily MACD
MACD line: 13.37 | Signal: 42.70 | Histogram: -29.33
The MACD line is below its signal with a negative histogram. The spread is significant but not yet turning up.
Human read: downside momentum is still active. There is no clear sign yet that the sell wave has fully run its course, but we are far enough into it that you start watching for a momentum slowdown over the next sessions.
Daily Bollinger Bands
Middle band: $3,178.86
Upper band: $3,411.44 | Lower band: $2,946.28
Close: $2,968.65 (just above the lower band)
ETH is hugging the lower band after a move down from the midline.
Human read: price is in the lower volatility envelope, which often means two things at once: the downtrend is valid, and we are entering a zone where mean-reversion bounces become more likely on short timeframes. The bigger question is whether those bounces can reclaim the mid-band near $3,180; until they do, they are just relief rallies in a downtrend.
Daily ATR (volatility)
ATR(14) daily: $115.21
Daily realized volatility is elevated but not at panic levels.
Human read: a typical daily swing of around $100–120 means a 3–4% move either way is completely normal here. Position sizing has to respect that, otherwise tight stop placements near obvious levels are likely to get shaken out.
Daily pivot levels
Pivot point (PP): $2,964.18
R1: $3,006.47 | S1: $2,926.36
Price is trading almost exactly at the daily pivot, after having probed near the lower Bollinger Band.
Human read: the market is at an intraday decision level. Holding above the pivot favors a short-term bounce toward $3,000–3,010, while a sustained break below $2,930 opens up continuation to fresh lows inside the daily downtrend.
Market context: risk-off, BTC-dominant environment
Crypto total market cap is around $3.10T, down roughly 2.1% in 24h, while 24h volume is up over 32%. That is the kind of mix you see in a de-risking phase, with prices slipping while activity spikes.
Bitcoin dominance sits near 57.5%, and ETH’s share of market cap is about 11.5%. In plain language, capital is preferring Bitcoin over Ethereum and altcoins. Combined with the Extreme Fear reading (24), the bigger picture is defensive, as traders are reducing beta and seeking perceived safety.
On-chain DeFi activity (Uniswap, Curve, etc.) is seeing strong fees. However, in this macro tape, higher DEX activity is more likely driven by hedging, stablecoin rotations, and volatility trading than a clean, risk-on rotation into ETH.
Lower timeframes: intraday bounce inside a larger downtrend
1H chart: weak but stabilizing
Price: $2,968.64
EMA20: $2,993.12 | EMA50: $3,070.71 | EMA200: $3,183.79
RSI(14): 35.25
MACD line: -35.13 | Signal: -41.94 | Histogram: +6.81
Bollinger mid: $2,976.64 | Upper: $3,014.69 | Lower: $2,938.60
ATR(14): $25.12
Pivot PP: $2,965.92 | R1: $2,971.79 | S1: $2,962.76
On the 1H, ETH is still in a downtrend, with price under all EMAs, but the very short-term momentum is trying to turn. RSI is in the 30s, weak but not washed out, while the MACD histogram has flipped positive even though both lines remain below zero.
Human read: sellers are losing a bit of steam intraday, but they still own the structure. Any bounce toward the 1H 20 EMA near $2,990–3,000 is, for now, just a test of resistance unless ETH can actually sit above it.
With price hovering around the hourly pivot at $2,965–2,972 and ATR around $25, short-term scalps can easily see $25–50 swings without changing the bigger picture. Above $3,015 (upper 1H band) would signal a more meaningful intraday squeeze, while below $2,940 reasserts bearish control.
15m chart: micro balance in a bearish regime
Price: $2,968.64
EMA20: $2,968.94 | EMA50: $2,978.27 | EMA200: $3,075.03
RSI(14): 48.63
MACD line: -2.94 | Signal: -3.17 | Histogram: +0.23
Bollinger mid: $2,968.86 | Upper: $2,982.84 | Lower: $2,954.89
ATR(14): $8.48
Pivot PP: $2,968.33 | R1: $2,969.38 | S1: $2,967.60
The 15-minute chart is essentially flat around its 20 EMA and mid-Bollinger band, with RSI close to 50 and a marginally positive MACD histogram.
Human read: very short-term, the market is catching its breath. The microstructure is neutral, but it sits inside a bearish hourly and daily context. That usually favors fading sharp spikes rather than chasing them, unless a clear breakout through higher timeframe levels appears.
Ethereum price scenarios from here
Bullish scenario: mean reversion and short-covering
For a credible bullish path, ETH needs to turn this short-term stabilization into a sustained move back toward the daily mid-range.
What a bullish continuation would look like:
- On the 15m / 1H, price holds above the hourly pivot near $2,965 and starts closing above the 1H 20 EMA around $2,990–3,000.
- RSI on the 1H climbs back above 50 while MACD crosses its signal and prints a growing positive histogram.
- That opens room toward the upper 1H Bollinger Band and 1H EMA50 in the $3,050–3,100 area.
- On the daily, ETH then needs to attack the Bollinger midline near $3,180. A reclaim and daily close above that level would be the first serious argument that the downtrend is shifting into a broader range.
Key bullish trigger zone: a sustained break and daily close above roughly $3,150–3,200 (20/50-day EMAs). That would signal that sellers are losing their grip on the medium-term trend and that the current move was a corrective pullback rather than the start of a deeper bear phase.
What invalidates the bullish case: if ETH fails to hold above the $2,930 region and starts closing daily candles near or under the lower Bollinger Band (sub-$2,950) with RSI sliding toward the low 30s, the narrative shifts from mean reversion to momentum continuation and the bullish scenario gets pushed much further out in time.
Bearish scenario: trend continuation and possible acceleration
The bears already control the higher timeframe. The question is whether they can turn this into another impulsive leg lower rather than letting the market base.
What a bearish continuation would look like:
- On the 15m / 1H, attempts to reclaim $3,000 are repeatedly rejected, with price stalling at or below the 1H 20 EMA.
- Hourly RSI remains stuck under 45, and the MACD histogram rolls back to negative after this brief pause.
- A decisive move below $2,930 (near S1 and just inside the lower daily band) triggers stops and brings in fresh trend-followers.
- Daily RSI pushes toward the low 30s while MACD widens further negative, indicating momentum is re-accelerating, not cooling.
From there, the downside targets come more from volatility than from any clean horizontal levels. With daily ATR around $115, a continuation leg could easily explore another $100–150 lower in a single session without any structural change.
Key bearish confirmation: multiple daily closes below the pivot region around $2,960 and persistent trading near or under the lower Bollinger Band. In that environment, every small intraday bounce is suspect and more likely to be sold into.
What invalidates the bearish case: if buyers can force a daily close back above $3,150–3,200 (20/50-day EMAs) and keep it there, the current bearish regime on the daily chart would be in serious doubt. A shift of daily RSI back above 50 alongside this move would confirm that the downtrend has transitioned into at least a broad range, if not the early stages of a new uptrend.
How to think about positioning around this Ethereum price zone
All three timeframes agree on one thing: ETH is in a bearish regime. The disagreement is about pace. Daily and hourly charts show a clear downtrend, while the 15m is just marking time around the local pivot. That is often what you see near inflection points, when the market is deciding whether to turn a pause into a reversal or just another step-down.
In a backdrop of Extreme Fear and high BTC dominance, aggressive long exposure in ETH is a bet against the current macro mood. It can work, but it relies on mean-reversion and short-covering rather than on a clean risk-on rotation into ETH. Conversely, shorts are trading with the trend, but they are doing so late in the move and with volatility elevated, which raises the risk of violent squeeze days.
Whatever the bias, risk needs to be sized for daily swings of at least 3–4%. Traders should be very clear about which timeframe they are trading. A 15m bounce can look impressive while still being completely irrelevant to the daily downtrend. The key battleground levels right now are roughly $2,930 on the downside and $3,150–3,200 on the upside. Behavior around those zones will tell you whether ETH is setting up for another leg lower or for a broader consolidation.
If you want to monitor markets with professional charting tools and real-time data, you can open an account on Investing using our partner link:
Open your Investing.com account
This section contains a sponsored affiliate link. We may earn a commission at no additional cost to you.
This article is a market commentary and is for informational purposes only. It is not investment, trading, or financial advice, and it should not be treated as a recommendation to buy or sell any asset. Cryptoassets are highly volatile and can result in total loss of capital. Always do your own research and assess your own risk tolerance before making trading decisions.


You May Also Like

Stock Market Tumbles as IBM and ServiceNow Earnings Disappoint While Oil Surges Past $102

U.S. military runs a Bitcoin (BTC) node, sees crypto as ‘power projection’ vs China