The post 4 Bearish On-Chain Signals Suggest Bitcoin Price Could Slide Toward $85K Next appeared first on Coinpedia Fintech News After the latest pullback, the BitcoinThe post 4 Bearish On-Chain Signals Suggest Bitcoin Price Could Slide Toward $85K Next appeared first on Coinpedia Fintech News After the latest pullback, the Bitcoin

4 Bearish On-Chain Signals Suggest Bitcoin Price Could Slide Toward $85K Next

2026/01/24 01:36
3 min read
Bitcoin Dips Below $89,000 as Bull Correction Deepens— What’s Next for BTC Price

The post 4 Bearish On-Chain Signals Suggest Bitcoin Price Could Slide Toward $85K Next appeared first on Coinpedia Fintech News

After the latest pullback, the Bitcoin price is recovering in such a way that traders do not appear to fully trust the bounce. Every push attracts selling, and dips aren’t getting filled with the required volume. When this happens, the BTC price usually drifts until it finds a level where buyers finally step in hard. Currently, a few on-chain indicators by Cryptoquant suggest the bearish momentum is gearing up and here are the 4 top ones. 

Whales look like they’re distributing

btc price

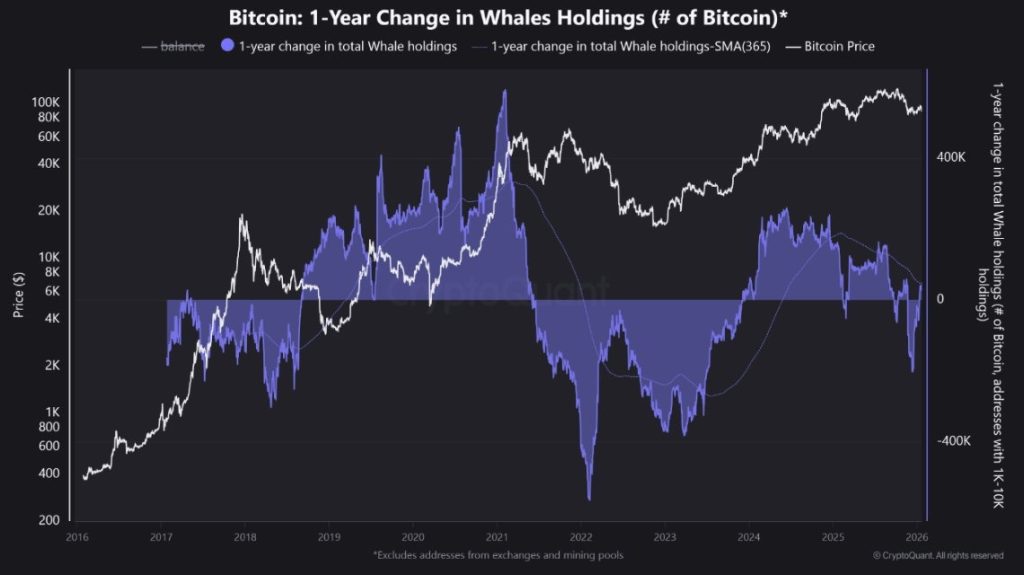
The “1-year change in whale holdings” metric is those addresses holding roughly 1K–10K BTC, showing whales shifting into a net distribution phase. Historically, when this line trends lower, it signals big holders are reducing exposure rather than accumulating. That doesn’t guarantee an immediate crash, but it often caps rallies and increases the odds of BTC revisiting lower liquidity zones because fewer large buyers are stepping in aggressively.

Apparent Demand Turns Negative

btc price

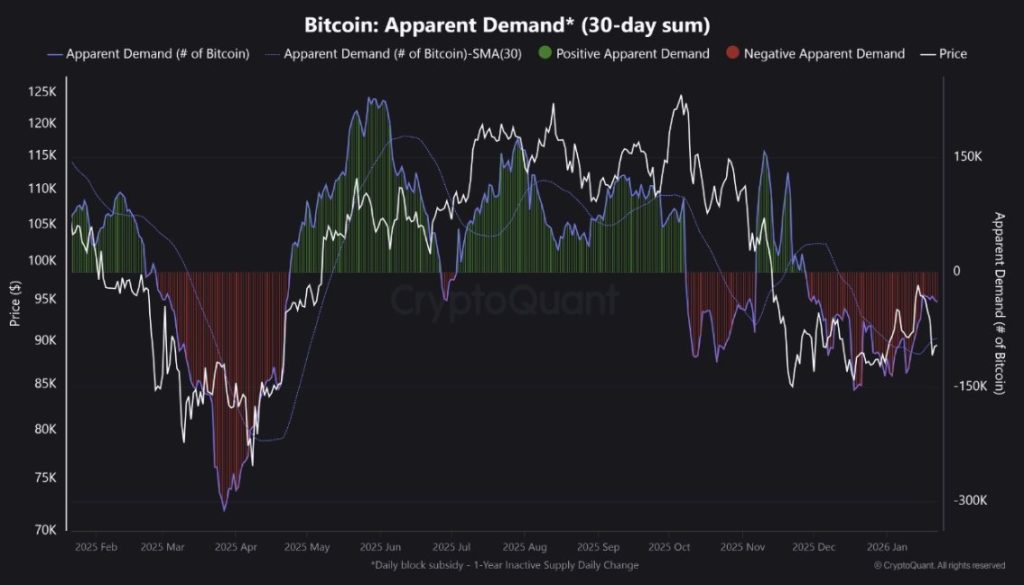
The “Apparent Demand (30-day sum)” chart is flashing negative readings, meaning net buyer pressure looks weak versus the supply dynamics tracked in this model. When apparent demand stays negative, BTC typically struggles to sustain recoveries because each bounce faces sell supply that demand cannot absorb. This often leads to a slow bleed—lower highs, weaker rebounds, and repeated tests of support—until demand flips back positive and holds.

Coinbase Premium Signals Weak US Spot Bid

btc price

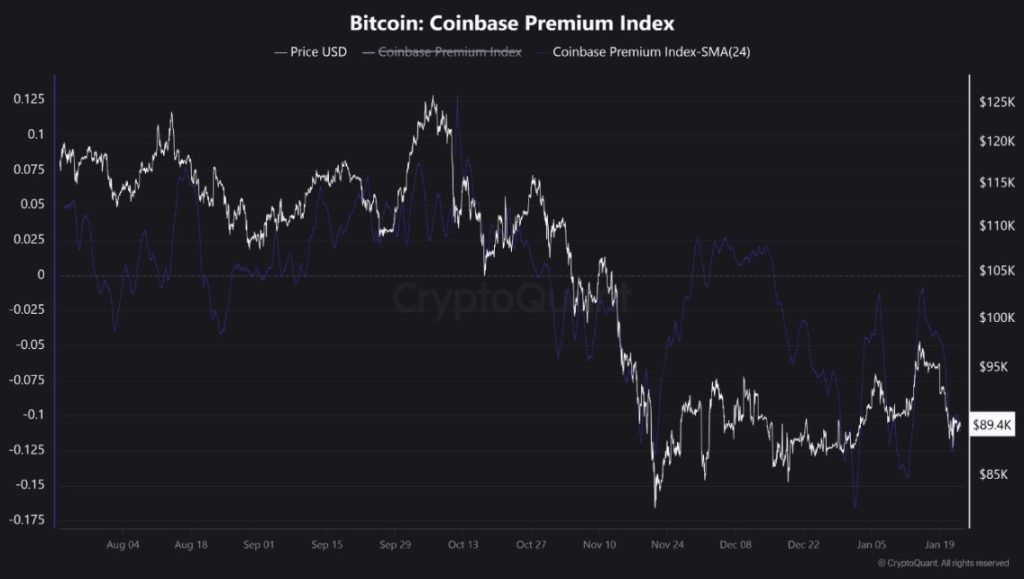
The Coinbase Premium Index being mostly below zero suggests BTC is not consistently trading at a premium on Coinbase versus offshore venues. That’s a sign the US spot bid appears soft. In risk-on phases, Coinbase’s premium tends to stay positive more often as spot demand leads. When it’s negative, it implies rallies may be driven more by derivatives or short-term flows, moves that can fade fast if spot follow-through is missing.

Dolphins are Also Distributing

btc price

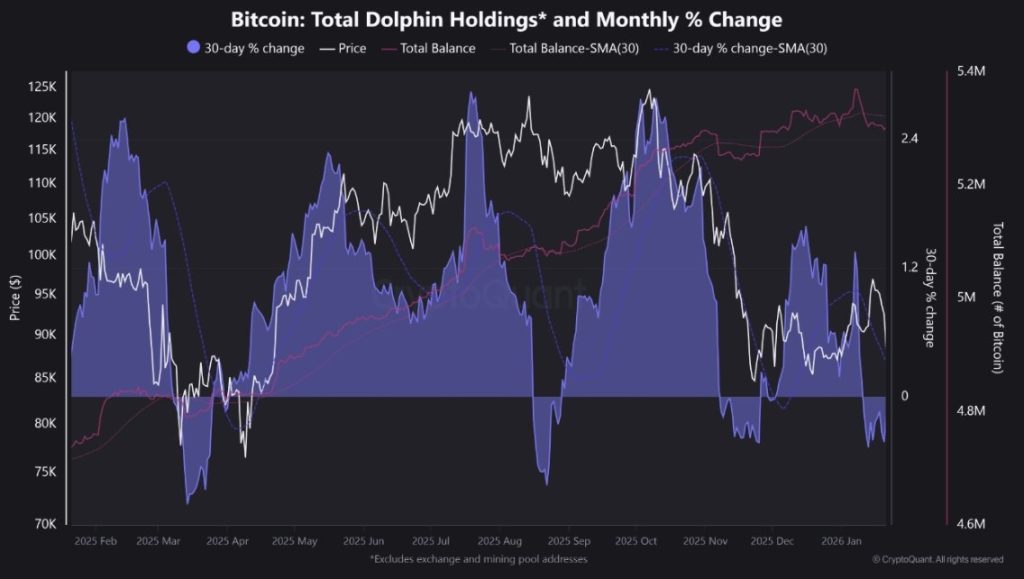
“Dolphin holdings” (often mid-tier wallets below whales) show a weakening monthly change and a drop toward/under the zero line—another distribution-style signal. When both whales and dolphins reduce exposure at the same time, it suggests selling pressure is broadening rather than being isolated to one cohort. This matters because BTC rallies are strongest when multiple cohorts accumulate together. If whales and dolphins sell while demand is negative, support levels tend to weaken.

What to expect next from BTC price action

These four signals together paint a clear risk: supply is rising while demand is not stepping up. That usually means BTC price remains vulnerable to another leg lower or at least deeper support tests.

What happens next depends on whether demand returns:

  • If BTC rebounds, expect a relief rally to face heavy selling unless (1) Coinbase Premium flips positive and holds, and (2) apparent demand turns positive. Without those, bounces can be short-lived.
  • If BTC breaks support, the downside can accelerate quickly as liquidity gets swept and dip buyers step aside. BTC typically stabilises only after demand improves and distribution slows.

Collectively, a Bitcoin (BTC) price rally is possible, but it needs spot demand confirmation. Otherwise, the path of least resistance stays down or sideways until buyers prove they’re back.

Disclaimer: The articles reposted on this site are sourced from public platforms and are provided for informational purposes only. They do not necessarily reflect the views of MEXC. All rights remain with the original authors. If you believe any content infringes on third-party rights, please contact service@support.mexc.com for removal. MEXC makes no guarantees regarding the accuracy, completeness, or timeliness of the content and is not responsible for any actions taken based on the information provided. The content does not constitute financial, legal, or other professional advice, nor should it be considered a recommendation or endorsement by MEXC.

You May Also Like

The UA Sprinkler Fitters Local 669 JATC – Notice of Privacy Incident

The UA Sprinkler Fitters Local 669 JATC – Notice of Privacy Incident

Landover, Maryland, February 6, 2026– The UA Sprinkler Fitters Local 669 Joint Apprenticeship and Training Committee (“JATC”) is providing notice of an event that
Share
AI Journal2026/02/07 07:30
CME pushes Solana, XRP into derivatives spotlight with new options

CME pushes Solana, XRP into derivatives spotlight with new options

CME Group is launching options for Solana and XRP futures this October. The move signals a major shift, acknowledging that institutional liquidity is now firmly expanding beyond the established dominance of Bitcoin and Ether. According to a press release dated…
Share
Crypto.news2025/09/18 01:18
Ethereum koers toont zeldzaam dubbel koopsignaal en richt zich op $4.550

Ethereum koers toont zeldzaam dubbel koopsignaal en richt zich op $4.550

Connect met Like-minded Crypto Enthusiasts! Connect op Discord! Check onze Discord   Ethereum laat op de uurgrafiek twee opeenvolgende TD Sequential koopsignalen zien. Deze indicator meet uitputting in een trend en geeft vaak een signaal dat de verkoopdruk kan afnemen. Dit dubbele signaal verschijnt rond het niveau van $4.516, waar de ETH prijs kortstondig steun vindt. Dit type formatie komt zelden voor en wordt daarom extra nauwlettend gevolgd. Wat gaat de Ethereum koers hiermee doen? Ethereum koers test steun rond $4.516 De scherpe daling van de Ethereum koers vanaf de prijszone rond $4.800 bracht de ETH prijs in korte tijd naar ongeveer $4.516. Op dit niveau trad duidelijke koopactiviteit op, waardoor de neerwaartse beweging tijdelijk werd gestopt. Het dubbele signaal dat door de TD Sequential indicator is gegenereerd, viel precies samen met dit prijspunt. De TD Sequential is opgebouwd uit negen candles die een trend meetellen. Wanneer de negende candle verschijnt, kan dit duiden op een trendomslag. In dit geval verschenen zelfs twee signalen kort na elkaar, wat aangeeft dat de verkoopdruk mogelijk uitgeput is. Het feit dat dit gebeurde in een zone waar ETH kopers actief bleven, maakt het patroon extra opvallend. TD Sequential just flashed two buy signals for Ethereum $ETH! pic.twitter.com/JPO8EhiEPi — Ali (@ali_charts) September 16, 2025 Welke crypto nu kopen?Lees onze uitgebreide gids en leer welke crypto nu kopen verstandig kan zijn! Welke crypto nu kopen? Fed-voorzitter Jerome Powell heeft aangekondigd dat de rentes binnenkort zomaar eens omlaag zouden kunnen gaan, en tegelijkertijd blijft BlackRock volop crypto kopen, en dus lijkt de markt klaar om te gaan stijgen. Eén vraag komt telkens terug: welke crypto moet je nu kopen? In dit artikel bespreken we de munten die… Continue reading Ethereum koers toont zeldzaam dubbel koopsignaal en richt zich op $4.550 document.addEventListener('DOMContentLoaded', function() { var screenWidth = window.innerWidth; var excerpts = document.querySelectorAll('.lees-ook-description'); excerpts.forEach(function(description) { var excerpt = description.getAttribute('data-description'); var wordLimit = screenWidth wordLimit) { var trimmedDescription = excerpt.split(' ').slice(0, wordLimit).join(' ') + '...'; description.textContent = trimmedDescription; } }); }); Technische indicatoren schetsen herstelkans voor ETH Naast de dubbele koopsignalen verstrekken ook andere indicatoren belangrijke aanwijzingen. Tijdens de daling van de ETH koers waren grote rode candles zichtbaar, maar na de test van $4.516 stabiliseerde de Ethereum koers. Dit wijst op een mogelijke verschuiving in het evenwicht tussen de bears en bulls. Als deze opwaartse beweging doorzet, liggen de eerste weerstanden rond $4.550. Daarboven wacht een sterkere zone rond $4.650. Deze niveaus zijn in eerdere Ethereum sessies al meerdere keren getest. Een doorbraak zou ruimte openen richting de all-time high van ETH rond $4.953. Wanneer de prijs toch opnieuw onder $4.516 zakt, liggen er zones rond $4.500 en $4.450 waar grotere kooporders worden verwacht. Deze niveaus kunnen als een vangnet fungeren, mocht de druk opnieuw toenemen. Marktdynamiek bevestigt technische indicatoren De huidige situatie volgt op een bredere correctie in de cryptomarkt. Verschillende vooraanstaande crypto tokens zagen scherpe koersdalingen, waarna traders op zoek gingen naar signalen voor een mogelijke ommekeer. Dat juist Ethereum nu een dubbel TD Sequential signaal toont, versterkt de interesse in dit scenario. Fundamenteel blijft Ethereum sterk. Het aantal ETH tokens dat via staking is vastgezet, blijft groeien. Dat verkleint de vrije circulatie en vermindert verkoopdruk. Tegelijk blijft het netwerk intensief gebruikt voor DeFi, NFT’s en stablecoins. Deze activiteiten zorgen voor een stabiele vraag naar ETH, ook wanneer de prijs tijdelijk onder druk staat. Fundamentele drijfveren achter de Ethereum koers De Ethereum koers wordt echter niet alleen bepaald door candles en patronen, maar ook door bredere factoren. Een stijgend percentage van de totale ETH supply staat vast in staking contracten. Hierdoor neemt de liquiditeit op exchanges af. Dit kan prijsschommelingen versterken wanneer er plotseling meer koopdruk ontstaat. Daarnaast is Ethereum nog steeds het grootste smart contract platform. Nieuwe standaarden zoals ERC-8004 en ontwikkelingen rond layer-2 oplossingen houden de activiteit hoog. Deze technologische vooruitgang kan de waardepropositie ondersteunen en zo indirect bijdragen aan een ETH prijsherstel. Het belang van de korte termijn dynamiek De komende handelsdagen zullen duidelijk maken of de bulls genoeg kracht hebben om door de weerstandszone rond $4.550 te breken. Voor de bears ligt de focus juist op het verdedigen van de prijsregio rond $4.516. De whales, die met grote handelsorders opereren, kunnen hierin een beslissende rol spelen. Het dubbele TD Sequential signaal blijft hoe dan ook een zeldzame gebeurtenis. Voor cryptoanalisten vormt het een objectief aanknopingspunt om de kracht van de huidige Ethereum trend te toetsen. Vooruitblik op de ETH koers Ethereum liet twee opeenvolgende TD Sequential signalen zien op de uurgrafiek, iets wat zelden voorkomt. Deze formatie viel samen met steun rond $4.516, waar de bulls actief werden. Als de Ethereum koers boven dit niveau blijft, kan er ruimte ontstaan richting $4.550 en mogelijk $4.650. Zakt de prijs toch opnieuw onder $4.516, dan komen $4.500 en $4.450 in beeld als nieuwe steunzones. De combinatie van zeldzame indicatoren en een sterke fundamentele basis maakt Ethereum interessant voor zowel technische als fundamentele analyses. Of de bulls het momentum echt kunnen overnemen, zal blijken zodra de Ethereum koers de eerstvolgende weerstanden opnieuw test. Koop je crypto via Best Wallet Best wallet is een topklasse crypto wallet waarmee je anoniem crypto kan kopen. Met meer dan 60 chains gesupport kan je al je main crypto coins aanschaffen via Best Wallet. Best wallet - betrouwbare en anonieme wallet Best wallet - betrouwbare en anonieme wallet Meer dan 60 chains beschikbaar voor alle crypto Vroege toegang tot nieuwe projecten Hoge staking belongingen Lage transactiekosten Best wallet review Koop nu via Best Wallet Let op: cryptocurrency is een zeer volatiele en ongereguleerde investering. Doe je eigen onderzoek. Het bericht Ethereum koers toont zeldzaam dubbel koopsignaal en richt zich op $4.550 is geschreven door Dirk van Haaster en verscheen als eerst op Bitcoinmagazine.nl.
Share
Coinstats2025/09/17 23:31