The current market momentum is bearish, with the major assets struggling to break free from the red zone. All the recent gains are fading, and the largest assetsThe current market momentum is bearish, with the major assets struggling to break free from the red zone. All the recent gains are fading, and the largest assets

Against the Odds: Livepeer (LPT) Defies a Slumping Market With a 20% Run

2026/01/24 19:38
3 min read
For feedback or concerns regarding this content, please contact us at crypto.news@mexc.com
  • Livepeer has jumped by over 20%, trading at $3.45.
  • LPT’s daily trading volume has exploded by 1,378%.

The current market momentum is bearish, with the major assets struggling to break free from the red zone. All the recent gains are fading, and the largest assets, like Bitcoin (BTC) and Ethereum (ETH), are attempting to escape the bear market. Among the altcoin pack, Livepeer (LPT) has registered a 20.64% jump in value over the last 24 hours. 

In the early hours, the asset traded at a bottom of $2.80. A sudden bullish encounter has triggered the LPT price to mount toward a high range of $3.57. It has tested and broken the crucial resistance zones to confirm the building uptrend. Livepeer is currently trading at around $3.45, with its daily trading volume having exploded by 1378% to $144.97 million. 

Livepeer’s four-hour trading chart exhibits the growing bullish zone. If the bulls gained more power, they could climb to the $3.66 resistance. Further upside likely initiates the golden cross formation and sends the asset’s price toward the $3.87 zone or even higher. 

Conversely, upon the asset’s bullish tone fades, the Livepeer price could slip to its immediate support at the $3.24 mark. Assuming it fails to hold this level, the bearish correction strengthens and triggers the emergence of the death cross, pushing the price below $3.03.

Livepeer Gains Bullish Traction as Indicators Show Uptrend Potential

Zooming in on the technical chart of Livepeer, the Moving Average Convergence Divergence (MACD) line is above the zero line while the signal line remains below zero. This points to a transition phase in momentum, and the bullish momentum is starting to build, but it has not been fully confirmed yet.

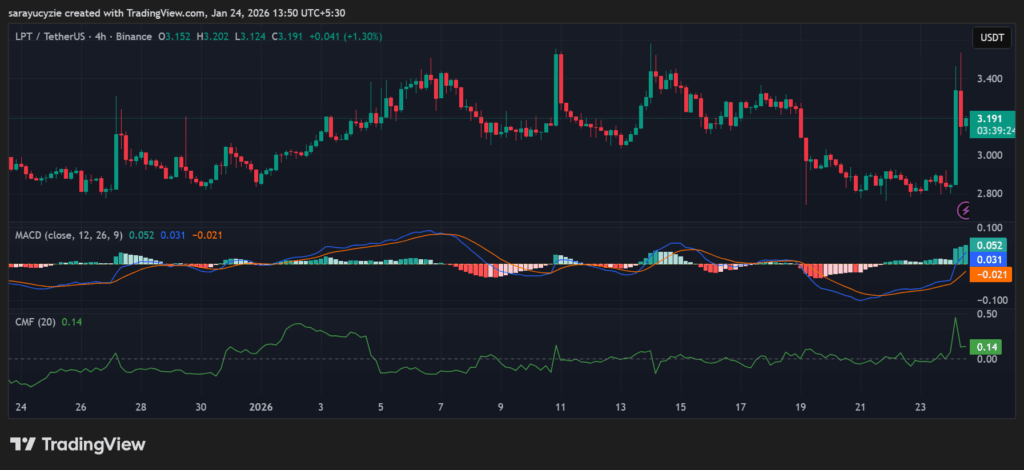
LPT chart (Source: TradingView)

Besides, the Chaikin Money Flow (CMF) is a technical indicator that evaluates the capital flow into the asset. The value sits at 0.14, showing moderate buying pressure, and the capital is flowing into the asset. The momentum of LPT is not very strong, but more upside would strengthen the bullish trend.

Livepeer’s daily Relative Strength Index (RSI) of 62.10 indicates moderate bullish sentiment. It is leaning toward the overbought zone, and the buyers are in control. Notably, a pullback could occur if the value continues to climb toward 70. In addition, LPT’s Bull Bear Power (BBP) reading resting at 0.355 suggests bullish dominance. Significantly, the upward pressure is outweighing the selling pressure, but it is still moderate.

Top Updated Crypto News

Bearish Winds Hit Pudgy Penguins (PENGU): Is Further Downside Still on the Table?

Disclaimer: The articles reposted on this site are sourced from public platforms and are provided for informational purposes only. They do not necessarily reflect the views of MEXC. All rights remain with the original authors. If you believe any content infringes on third-party rights, please contact crypto.news@mexc.com for removal. MEXC makes no guarantees regarding the accuracy, completeness, or timeliness of the content and is not responsible for any actions taken based on the information provided. The content does not constitute financial, legal, or other professional advice, nor should it be considered a recommendation or endorsement by MEXC.

You May Also Like

TradFi Titan BlackRock Debuts Staked Ethereum ETF, Letting Investors Earn Yield Alongside ETH Exposure ⋆ ZyCrypto

TradFi Titan BlackRock Debuts Staked Ethereum ETF, Letting Investors Earn Yield Alongside ETH Exposure ⋆ ZyCrypto

The post TradFi Titan BlackRock Debuts Staked Ethereum ETF, Letting Investors Earn Yield Alongside ETH Exposure ⋆ ZyCrypto appeared on BitcoinEthereumNews.com.
Share
BitcoinEthereumNews2026/03/13 12:15
UK crypto holders brace for FCA’s expanded regulatory reach

UK crypto holders brace for FCA’s expanded regulatory reach

The post UK crypto holders brace for FCA’s expanded regulatory reach appeared on BitcoinEthereumNews.com. British crypto holders may soon face a very different landscape as the Financial Conduct Authority (FCA) moves to expand its regulatory reach in the industry. A new consultation paper outlines how the watchdog intends to apply its rulebook to crypto firms, shaping everything from asset safeguarding to trading platform operation. According to the financial regulator, these proposals would translate into clearer protections for retail investors and stricter oversight of crypto firms. UK FCA plans Until now, UK crypto users mostly encountered the FCA through rules on promotions and anti-money laundering checks. The consultation paper goes much further. It proposes direct oversight of stablecoin issuers, custodians, and crypto-asset trading platforms (CATPs). For investors, that means the wallets, exchanges, and coins they rely on could soon be subject to the same governance and resilience standards as traditional financial institutions. The regulator has also clarified that firms need official authorization before serving customers. This condition should, in theory, reduce the risk of sudden platform failures or unclear accountability. David Geale, the FCA’s executive director of payments and digital finance, said the proposals are designed to strike a balance between innovation and protection. He explained: “We want to develop a sustainable and competitive crypto sector – balancing innovation, market integrity and trust.” Geale noted that while the rules will not eliminate investment risks, they will create consistent standards, helping consumers understand what to expect from registered firms. Why does this matter for crypto holders? The UK regulatory framework shift would provide safer custody of assets, better disclosure of risks, and clearer recourse if something goes wrong. However, the regulator was also frank in its submission, arguing that no rulebook can eliminate the volatility or inherent risks of holding digital assets. Instead, the focus is on ensuring that when consumers choose to invest, they do…
Share
BitcoinEthereumNews2025/09/17 23:52
Edges higher ahead of BoC-Fed policy outcome

Edges higher ahead of BoC-Fed policy outcome

The post Edges higher ahead of BoC-Fed policy outcome appeared on BitcoinEthereumNews.com. USD/CAD gains marginally to near 1.3760 ahead of monetary policy announcements by the Fed and the BoC. Both the Fed and the BoC are expected to lower interest rates. USD/CAD forms a Head and Shoulder chart pattern. The USD/CAD pair ticks up to near 1.3760 during the late European session on Wednesday. The Loonie pair gains marginally ahead of monetary policy outcomes by the Bank of Canada (BoC) and the Federal Reserve (Fed) during New York trading hours. Both the BoC and the Fed are expected to cut interest rates amid mounting labor market conditions in their respective economies. Inflationary pressures in the Canadian economy have cooled down, emerging as another reason behind the BoC’s dovish expectations. However, the Fed is expected to start the monetary-easing campaign despite the United States (US) inflation remaining higher. Investors will closely monitor press conferences from both Fed Chair Jerome Powell and BoC Governor Tiff Macklem to get cues about whether there will be more interest rate cuts in the remainder of the year. According to analysts from Barclays, the Fed’s latest median projections for interest rates are likely to call for three interest rate cuts by 2025. Ahead of the Fed’s monetary policy, the US Dollar Index (DXY), which tracks the Greenback’s value against six major currencies, holds onto Tuesday’s losses near 96.60. USD/CAD forms a Head and Shoulder chart pattern, which indicates a bearish reversal. The neckline of the above-mentioned chart pattern is plotted near 1.3715. The near-term trend of the pair remains bearish as it stays below the 20-day Exponential Moving Average (EMA), which trades around 1.3800. The 14-day Relative Strength Index (RSI) slides to near 40.00. A fresh bearish momentum would emerge if the RSI falls below that level. Going forward, the asset could slide towards the round level of…
Share
BitcoinEthereumNews2025/09/18 01:23