Bitcoin, Ethereum, and XRP ETFs See Massive Outflows Amid Rising Fear

Highlights:
- U.S. Bitcoin ETFs lost $1.72 billion in five days as investor confidence fell.
- Ethereum and XRP ETFs faced heavy redemptions, while Solana posted steady inflows.
- Crypto Fear & Greed Index hit 25, which signals extreme fear among investors.
U.S.-listed Bitcoin exchange-traded funds have seen withdrawals for five consecutive days as investor confidence in the crypto market weakens. On Friday alone, these ETFs recorded $103.5 million in net outflows, extending a streak that started the previous Friday. Over the past week, total outflows reached around $1.72 billion, according to Farside data.
Only one week earlier, investor confidence looked strong. Spot Bitcoin ETFs recorded $1.42 billion in net inflows during that period. However, sentiment turned quickly as caution returned across digital asset markets and selling pressure increased. Trading patterns reflected growing concern.
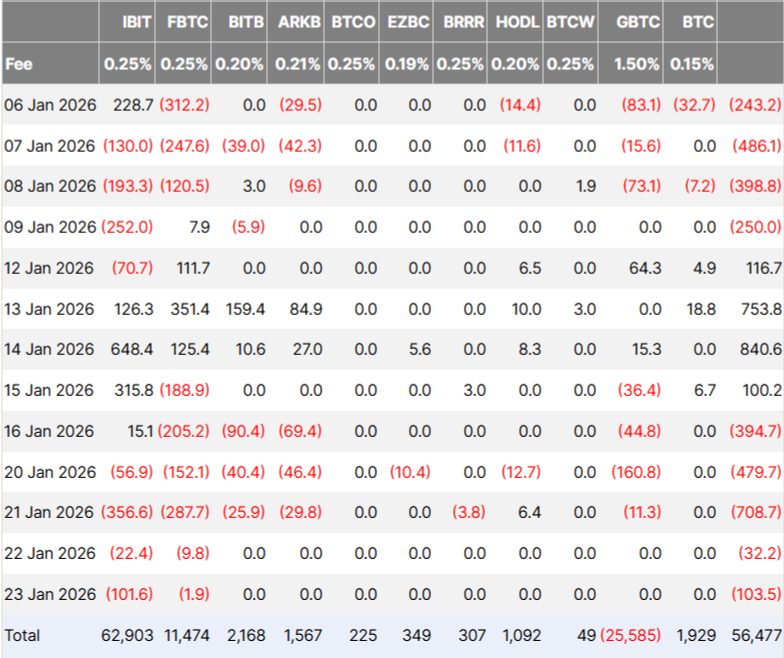
Bitcoin ETFs Lost $1.72 Billion in Five Days
Outflows from Bitcoin exchange-traded funds began on January 16, when investors pulled $394.68 million from the market. After a brief pause during the weekend closure, redemptions picked up again on January 20, with another $483.38 million withdrawn. The following day, January 21, proved the most severe, recording a staggering $708.71 million in single-day outflows. On January 22, funds lost $32.11 million, and by January 23, an additional $103.57 million had exited.
 Source: Farside
Bitcoin prices reflected the weak demand. CoinMarketCap data showed Bitcoin trading at $89,160 at publication time. The price has remained below the $100,000 level since Nov. 13.
Ethereum and XRP ETFs Hit by Outflows, Solana Shows Steady Inflows
Market participants often watch ETF flows to measure retail interest. Recent figures pointed to declining confidence and rising risk avoidance. As a result, expectations for near-term Bitcoin direction weakened. Ethereum-linked funds faced similar pressure.
Spot Ether ETFs recorded $611 million in net outflows for the week. The move reversed a prior $479 million inflow streak. Wednesday again proved the weakest session, with $298 million redeemed. Tuesday followed closely with $230 million in outflows. Despite losses, Ether ETFs maintained total net assets near $17.7 billion.
In contrast, spot Solana ETFs moved against the broader trend. Funds recorded $9.6 million in net inflows over the week, extending a multi-week positive run. Bitwise’s BSOL continued to lead the category by assets. Spot XRP ETFs showed weaker results. Funds ended the week with $40.6 million in net outflows after a sharp $53 million exit on Tuesday.
Crypto Sentiment Shows Rising Fear
The market mood worsened as the Crypto Fear & Greed Index hit 25, which signals “Extreme Fear.” Retail traders are exiting, shifting attention to traditional assets. Santiment called the market “unstable,” though supply trends and low social chatter hint at a potential bottom forming. Many retail traders are leaving, while money and attention are moving to traditional assets. At the same time, small signals, like supply changes and less social activity, hint at a possible bottom that may be forming.
Analyst Nik Bhatia linked Bitcoin’s weak mood to the strong rise in precious metals. With gold near $5,000 and silver around $100, he said, Bitcoin missing out on this rally has created a feeling similar to the post-FTX $17,000 bear market. Still, Bhatia remained cautiously optimistic, noting that fear dominates but progress requires staying involved and pushing through tough times.
eToro Platform
Best Crypto Exchange
- Over 90 top cryptos to trade
- Regulated by top-tier entities
- User-friendly trading app
- 30+ million users
eToro is a multi-asset investment platform. The value of your investments may go up or down. Your capital is at risk. Don’t invest unless you’re prepared to lose all the money you invest. This is a high-risk investment, and you should not expect to be protected if something goes wrong.


You May Also Like

Data focus shifts to payrolls – Societe Generale

MEXC Chain Observation Daily Day 1