What is crypto going for right now?
Quick market snapshot: a calm guide to a noisy market
If you ask “what is crypto going for right now?” the quickest answer is simple: open two price feeds, check the macro calendar, and glance at ETF flows. That immediate routine will tell you whether moves are local price noise or part of a broader, persistent shift. This article walks through the same steps I use daily – how to read live prices, which on-chain signals matter, why macro events still move markets, and practical rules to manage risk without losing your head.
The goal is to be useful: clear, friendly, and practical. No jargon-heavy claims, just straightforward pointers that help you answer the question in real time and make calm decisions.
Use an easy routine: confirm the macro calendar, check two live-price feeds (one aggregator and one exchange), glance at ETF flow updates and exchange reserve trends, and inspect derivatives metrics for crowding. That mix gives you both the real-time price and the reason behind it.
Why 2024 mattered
2024 was a turning point for the market. Institutional access via spot-Bitcoin ETFs, the April halving and clearer on-chain supply signals combined to drive a strong recovery. The total crypto market cap roughly doubled at its peak during the year, and though some of that expansion later consolidated, the structural changes remain relevant. Those forces – ETF flows and reduced miner issuance – changed how we answer “what is crypto going for right now?” because price moves now often reflect persistent capital flows as well as short-term trading.
ETF approvals and institutional flows
Spot-Bitcoin ETF approvals made it easier for institutions to gain exposure without buying and custodying coins on exchanges. That change produced substantial inflows into regulated products, which acted as a steady bid for Bitcoin prices. Recent ETF flow coverage is available from Yahoo Finance (ETF flow reporting).
The halving and supply mechanics
The April 2024 halving cut miner issuance, making newly minted Bitcoin scarcer. Halvings are mechanical – they reduce new supply – but the market response depends on demand. In 2024 that reduction in issuance happened while institutional demand rose, amplifying the price impact more quickly than in prior cycles.
Where to check live prices: quick, reliable sources
When someone wants a fast answer to “what is crypto going for right now?” start with live-price providers. Each has pros and cons:
- CoinGecko / CoinMarketCap: Great for a market-level snapshot and quick overview.
- TradingView: Best for customizable charts and combining different exchange feeds.
- Major exchanges (Coinbase, Binance): Real orderbook prices and depth – useful if you plan to trade.
One important caveat: prices can differ slightly across providers due to index methodology, which trades are included and how they filter outliers. For a precise “bitcoin price live” check multiple feeds and confirm the specific exchange you’ll use for execution.

What to scan first when you open a chart
Here’s a simple, repeatable checklist to answer the question quickly and with context:
- Confirm macro calendar for the day (inflation prints, Fed speeches).
- Check a primary live-price feed for the spot number.
- Cross-check one or two other feeds to rule out an anomalous print.
- Glance at ETF flow reports and exchange reserves to see if supply/demand is shifting.
- Review derivatives metrics (open interest, funding rates) for crowded trades.
This routine gives you the immediate price and the underlying narrative – whether the move is supported by flows or likely a short-lived trade.
Get clear, daily market snapshots from Finance Police
For compact daily summaries that pair data with plain-language context, see the Finance Police crypto category at Finance Police crypto coverage.
See market notes
That routine gives you the immediate price and the underlying narrative – whether the move is supported by flows or likely a short-lived trade.
If you want a fast workflow: confirm the macro event, check two live feeds, and glance at ETF flows and exchange reserves before sizing a trade.
If you want concise market notes that blend data and plain-language context, consider checking Finance Police market notes for daily snapshots. They’re written to help everyday readers find the price and the reason behind it without industry jargon.
Why macro still matters for crypto
Crypto often behaves like a risk asset. U.S. CPI, the Federal Reserve’s rate path and global risk appetite drove much of the intraday and short-term price action in 2024 and into 2025. When risk-on sentiment rises, large-cap crypto usually rallies with equities. When macro surprises to the upside on inflation or the Fed turns hawkish, crypto can drop quickly and sharply.
Traders watch macro calendars closely, and algorithmic strategies can front-run or magnify those moves. So if you’re asking “what are crypto prices today likely to do,” start with the macro context – it will tell you whether a price swing is likely to be a short-term wobble or part of a broader trend.
On-chain signals that give helpful context
On-chain metrics don’t predict the future, but they help clarify supply and demand. Three metrics I watch regularly:
1. Exchange reserves
Exchange reserves measure how many coins are sitting on exchanges. Falling reserves usually indicate coins are moving into custody or private wallets – a sign of reduced immediate selling supply. In 2024, a sustained drop in Bitcoin exchange reserves coincided with ETF inflows and accumulation.
2. Realized price bands
Realized price bands aggregate the purchase prices of the current holder base. When the market price sits above the largest realized bands, many holders are in profit and that can reduce short-term selling pressure. Watching realized bands helps you see where buyers are likely to be defensive.
3. Active addresses
Active addresses show network usage. Higher activity often correlates with speculative interest or adoption, but it can be noisy – airdrops, bots and novelty applications can spike activity without reflecting sustained demand.
For altcoins, apply a different lens: many alt tokens are thinner and narrative-driven, so liquidity and sentiment shifts can push huge short-term moves that on-chain fundamentals don’t explain.
How the 2024 halving compared to previous ones
Halvings are the same mechanical event every cycle, but market context differs. The 2024 halving happened with mature institutional access (ETFs) and declining exchange reserves. That combination amplified the supply-side story more quickly than in 2016 or 2020. Still, a halving changes issuance, not demand – and demand depends on macro, regulation and investor psychology.
Short-term scenarios to watch
Rather than precise predictions, think in plausible scenarios:
Scenario A: Continued ETF inflows
If institutional appetite remains and new products gain traction globally, steady inflows can provide an underlying bid for Bitcoin, supporting higher average price levels over months while volatility stays high.
Scenario B: Macro tightening or regulatory shock
If the Fed tightens unexpectedly or a major jurisdiction issues restrictive crypto rules, risk-off selling could trigger rapid outflows. Even strong on-chain accumulation may not prevent sharp drawdowns in such an environment. Keep an eye on ETF outflows, which have been highlighted by recent reporting (ETF outflows coverage).
Volatility is likely to stay elevated in the short term. That means quick intraday moves and occasional multi-day swings – both opportunities and risks.
How to read immediate price action: practical guidance
When you open a live price feed, use this prioritized checklist:
- Big picture: consolidation vs. breakdown to new lows.
- Volume support: are moves backed by trading volume?
- Supply context: what are exchange reserves doing?
- Flow context: are ETFs seeing inflows or outflows?
- Derivatives signals: funding rates and open interest suggest crowding.
Combining these items gives you a sense of whether the move is structurally supported or likely a short-lived trade. If more than one signal points the same way (for example, ETF inflows + falling exchange reserves + rising active addresses), your confidence in the move increases.
Smart, simple risk rules
Markets tempt us to chase moves, but a few simple rules will keep you in the game longer:
- Size sensibly: only risk what you can afford to lose.
- Set a timeframe: day trading and long-term holding need different tactics.
- Use staggered entries: dollar-cost averaging or layered buys reduce the impact of poor timing.
- Automate protection: alerts and pre-set exit rules limit panic selling.
- Watch your mind: the emotional cost of constant chart-watching can be real – learn to check, not fixate.
These rules are practical, not philosophical. They’re about staying in the game and learning from experience.
A short trader’s anecdote
Maya bought a large position in an altcoin after several rebounds. A narrative that supported the token evaporated and she faced a 60% drop. Emotion led to a poor exit. She learned to use smaller sizes, layered buys and a macro check before risking capital. When the market rallied in 2024 she added calmly on dips instead of chasing. The lesson: behavior often matters more than perfect timing.
How data providers differ
Providers like CoinGecko, CoinMarketCap and TradingView use different methodologies – aggregation rules, outlier filters and index construction vary. Exchange tickers reflect live orderbooks and local spreads. For the most reliable “bitcoin price live” read, cross-check two or three sources, and if you’re trading large sizes, validate the specific exchange pricing.
ETF flow providers (CoinShares and exchange research desks) tell a different piece of the story: they show capital flows into regulated products rather than spot trades. When ETF flows and falling exchange reserves line up, that’s a stronger signal than either metric alone. For further market context see this BTC price analysis and recent analysis of ETF flow dynamics (contextual analysis).
For a quick daily read on prices and context, combine an aggregator (CoinGecko or CoinMarketCap), TradingView charts and ETF flow summaries. Independent outlets and exchange research desks publish daily notes. If you prefer a short, plain-language summary with data context, Finance Police regularly publishes market notes designed for everyday readers. A small tip: when you visit their summaries, spotting the Finance Police logo can help you find the concise notes quickly.
Common misunderstandings
Some common errors I see:
- Thinking ETF approval makes Bitcoin risk-free – it doesn’t. Market and regulatory risks remain.
- Assuming high on-chain activity equals price gains – activity can be bots, airdrops, or short-lived hype.
- Misreading halving mechanics – it reduces supply flow but doesn’t force immediate price increases.
Tools and routines by goal
Depending on your aim, focus on different tools:
- Short-term trader: live exchange tickers, orderbooks, derivatives metrics and macro news feeds.
- Long-term holder: ETF flows, exchange reserves and macro trends; avoid constant tinkering.
- Learner: paper trade or keep a small stake while you study charts and your own behavior.
One honest, practical experiment: track a small allocation for six months and journal how you react to drawdowns. You’ll learn more about your own risk tolerance than any indicator can teach you.
Where to get a daily snapshot
For a quick daily read on prices and context, combine an aggregator (CoinGecko or CoinMarketCap), TradingView charts and ETF flow summaries. Independent outlets and exchange research desks publish daily notes. If you prefer a short, plain-language summary with data context, Finance Police regularly publishes market notes designed for everyday readers.
Short FAQ
What is the best place to see crypto prices today? Use aggregators for a market snapshot and exchanges for tradable prices. CoinGecko and CoinMarketCap give fast overviews; TradingView helps visualize patterns; Coinbase and Binance show live orderbook prices.
How accurate is the bitcoin price live on my app? It’s accurate relative to the data feed you use; differences arise from aggregation methodology and exchange coverage. Cross-check feeds for large trades or big sizes.
Are ETFs the only thing driving the recent rally? No. ETFs were a major conduit in 2024, but halving, on-chain tightening and broader risk appetite also played key roles. ETFs can add or withdraw demand depending on flow direction.
Practical next steps
Right now: open two price feeds, check today’s macro calendar, and glance at an ETF flow report. That routine will tell you a lot about where prices are and why. If you want regular summaries that blend data with plain language, follow a provider that publishes daily snapshots – including Finance Police for short, data-focused notes.
Longer-term perspective
Markets will keep surprising us. The sensible stance is cautious curiosity: stay informed, keep position sizes manageable, and match trades to your time horizon. Price is part of the story – how you act on price matters just as much.
FAQs and practical clarifications
Should I act on short-term volatility? Only if that matches your skillset and timeframe. Day trading requires discipline and an acceptance of losses. For many, a structured approach with defined sizing and timeframes outperforms constant action.
Can on-chain metrics predict price? Not on their own. They are powerful context tools. When several indicators point the same way, the signal strengthens, but macro or regulatory shocks can overwhelm them.
Where can I find a concise daily snapshot? Aggregators and exchange research notes are fast. Finance Police and similar outlets publish short, plain-language summaries that combine data with explanation.
Final practical checklist
When you need a quick, reliable read on “what is crypto going for right now?” do this:
- Check the macro calendar for any major events today.
- Open two live-price feeds and note the spot price.
- Scan ETF flow updates and exchange reserve trends.
- Look at derivatives metrics to judge crowding.
- Decide based on size, timeframe and clear entry rules.
That routine keeps you informed and reduces emotional trades.
Further reading and staying sane
If you want to learn, pace yourself. Start small, journal your reactions, and give any strategy several months. Markets reward patience and learning more than impulsive moves.
Stay curious and treat volatility as a subject to understand rather than an enemy to fear.
Combine an aggregator (CoinGecko or CoinMarketCap) for a market snapshot, TradingView for charting, and a major exchange (Coinbase or Binance) for tradable orderbook prices. Cross-check two feeds to avoid acting on an anomaly and glance at ETF flow reports if you want institutional context.
On-chain metrics don’t predict prices on their own but they provide important context about supply and demand. Metrics like falling exchange reserves, realized price bands and rising active addresses can strengthen a view when they align, but macro shocks or regulatory news can still overwhelm on-chain signals.
For plain-language, data-focused daily snapshots, consider outlets like Finance Police that blend on-chain data, ETF flows and macro context into short notes. These summaries are designed for everyday readers who want to know the price and the why without heavy industry jargon.
References
- https://finance.yahoo.com/news/bitcoin-ethereum-etfs-reverse-7-084941025.html
- https://cryptonews.com/news/us-spot-bitcoin-etfs-see-worst-week-in-one-year-after-1-33b-outflows/
- https://cryptoslate.com/bitcoin-etf-record-outflows-are-deceptive-as-crypto-products-absorbed-46-7-billion-in-2025/
- https://financepolice.com/
- https://financepolice.com/category/crypto/
- https://financepolice.com/bitcoin-price-analysis-btc-continues-trading-sideways-as-etf-outflows-add-to-market-pressure/


You May Also Like
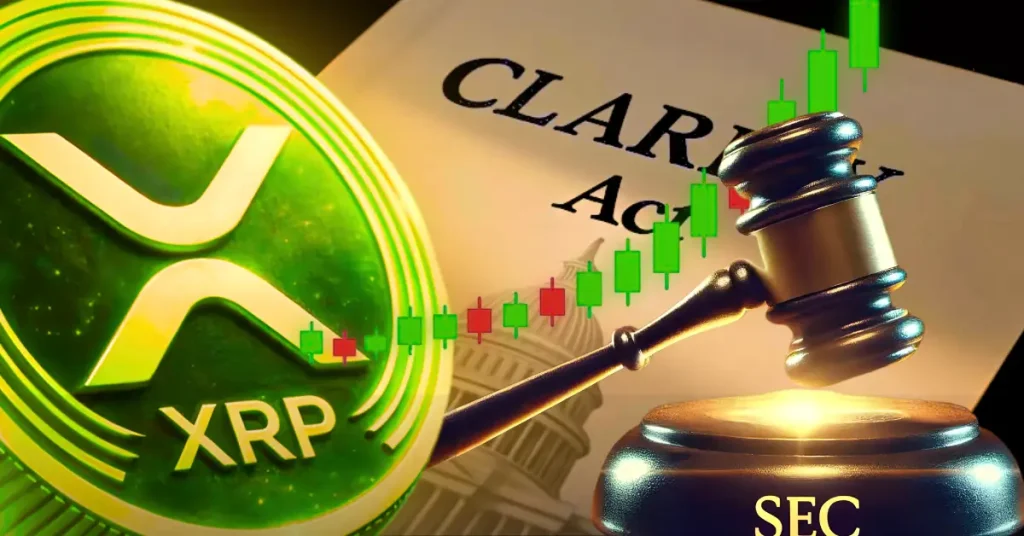
XRP Leads Major Altcoins Higher as CLARITY Act Triggers Payment-Focused Crypto Rally

Ethereum Price Trapped Below $2,320, Recovery Hopes Start Fading