

Solana (SOL) Price: ETF Inflows Reach $1.1 Billion as Token Bounces Off Key Support
TLDR
- Solana bounced off the $120 support level after sharp losses during the Asian trading session
- Daily trading volume exploded by 278% to reach $6.3 billion, representing 9% of SOL’s market cap
- SOL ETFs attracted $10 million in new assets from Monday to Thursday last week, bringing total assets to $1.1 billion
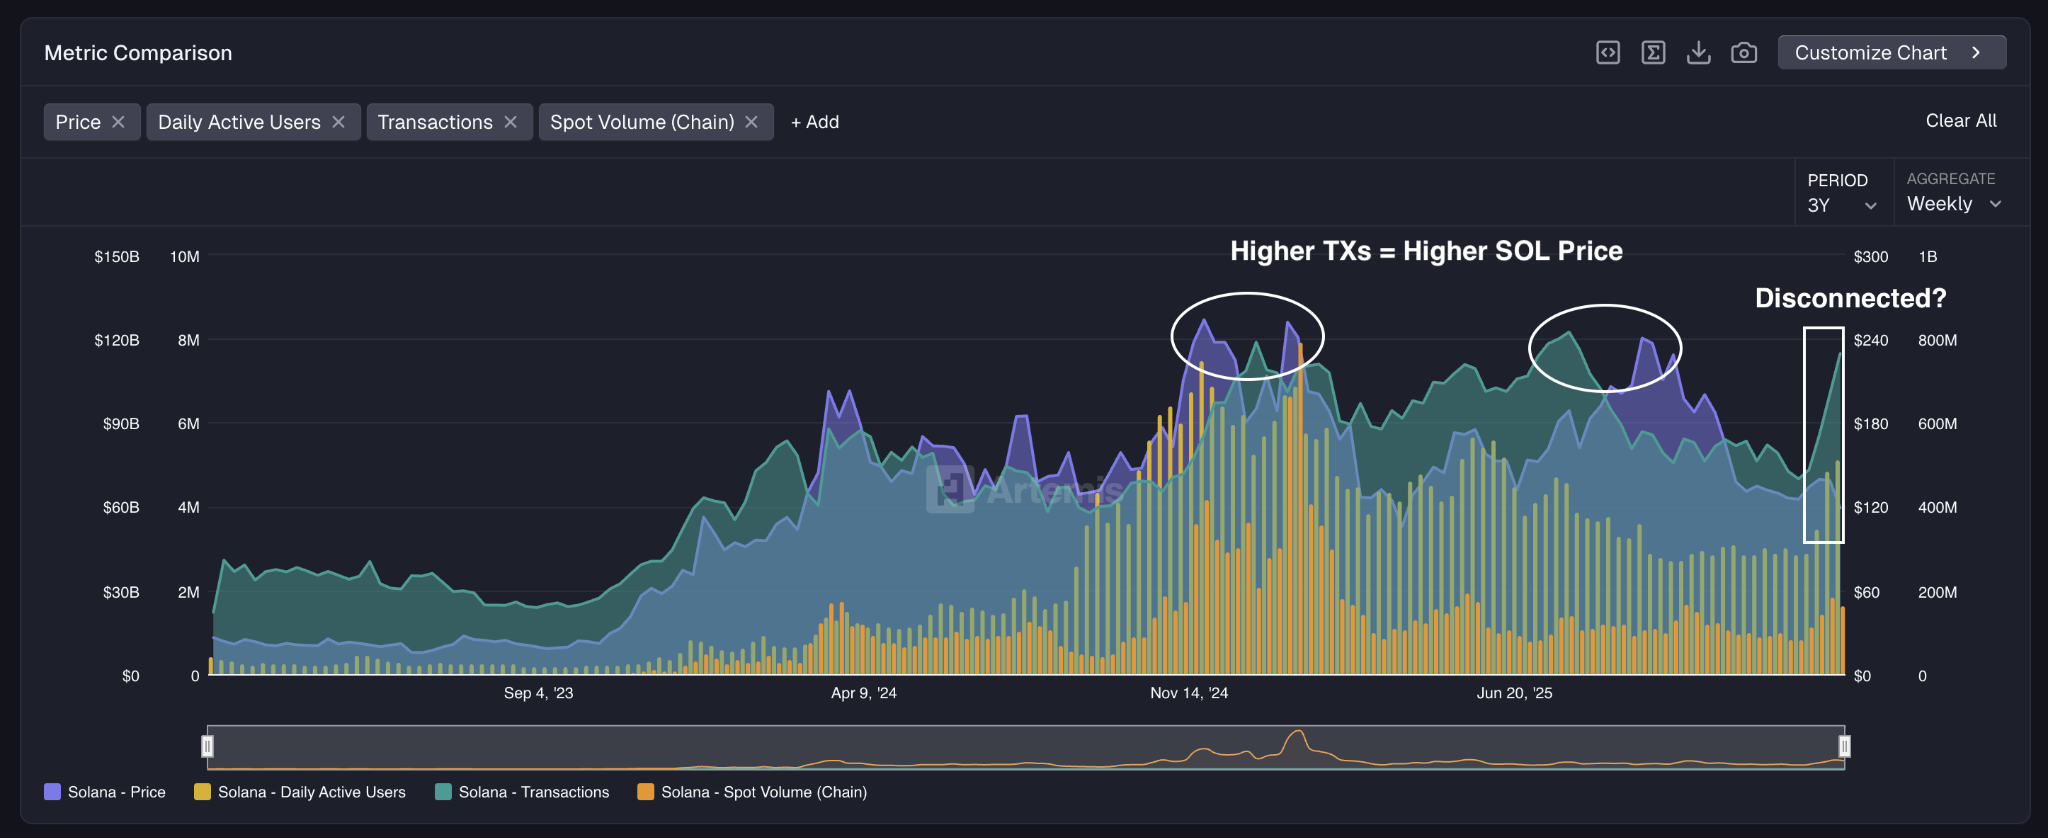
- On-chain metrics show strong network activity with weekly active users hitting 5.1 million and transaction volumes reaching 764.9 million
- Technical indicators suggest SOL could drop to $97 if the $120 support level fails to hold
Solana’s price tested a critical support level at $120 over the weekend as markets reacted to unexpected tariff announcements from President Donald Trump.
 Solana (SOL) Price
The cryptocurrency fell to a session low of $118 during the Asian trading session on Sunday before quickly recovering. The sharp price movement came after Trump threatened to impose 100% tariffs on Canada if the country struck a deal with China.
Trading activity increased dramatically during the sell-off. Daily volume jumped 278% to $6.3 billion, accounting for 9% of Solana’s total market cap.
The Crypto Fear and Greed Index dropped from 54 to 29, reflecting growing uncertainty among investors. Market participants remain cautious about the near-term outlook as trade tensions continue to affect cryptocurrency prices.
Despite the price decline, Solana’s network fundamentals showed strong growth. Weekly active users reached 5.1 million last week, up 4% from the previous week and marking the highest level since June 2025.
Transaction volumes also increased substantially. The network processed 764.9 million transactions last week, up 64% from 466 million transactions in late December.
Network Activity vs Price Action
The current transaction volume levels match those seen when SOL traded above $200 in previous months. This creates a disconnect between network usage and token price.
 Source: Artemis
Historical data shows that similar transaction volumes corresponded with SOL trading at $253 in November 2024 and $240 in September 2025. The gap suggests the current price may not reflect the network’s actual usage and adoption.
Institutional interest in Solana remains steady. SOL ETFs received $10 million in inflows from Monday to Thursday last week. Total ETF assets now stand at $1.1 billion.
Technical Outlook
The $120 level has proven to be a key support zone for SOL. Buyers have stepped in to defend this price point multiple times.
The Relative Strength Index on the daily chart fell below its 14-day moving average. This indicates that selling pressure has increased in recent sessions.
If SOL breaks below $120, the next support level sits at the lower bound of a descending price channel. A failure to hold that level could push the price toward $97, which would be the lowest point since April 2025.
Resistance currently sits at $145. Solana has faced selling pressure each time it has attempted to break above this level.
The 4-hour chart showed a sell signal during Sunday’s Asian session decline. However, buying pressure returned quickly once the price hit $120.
A move above $125 would signal a potential trend reversal. This could open the path for SOL to test $130 and then $145.
Current market sentiment favors continued downside pressure. The combination of macroeconomic uncertainty and trade tensions continues to weigh on cryptocurrency prices across the board.
Transaction volumes on Sunday confirmed the $120 level as a highly contested area. The outcome at this price point will likely determine Solana’s direction in the coming sessions.
The post Solana (SOL) Price: ETF Inflows Reach $1.1 Billion as Token Bounces Off Key Support appeared first on CoinCentral.


You May Also Like

Stunning 96% Surge And 50% Plunge Define Volatile Market Session

BitGo Holdings (BTGO) Stock Climbs Following Launch of Institutional Stablecoin Platform


