Bitcoin appears poised to make another upward move, and could reach a new peak in Q3 or early Q4 if there is no further deterioration in traditional markets.Bitcoin appears poised to make another upward move, and could reach a new peak in Q3 or early Q4 if there is no further deterioration in traditional markets.

From 100,000 to 75,000: The cyclical truth behind the deep correction and the signal of bull market restart​

2025/04/21 17:12
5 min read

Author: BITCOIN MAGAZINE PRO

Compiled by: Tim, PANews

Bitcoin did not have the explosive start many expected in early 2025. After peaking above $100,000, the price fell sharply, leaving investors and analysts questioning where in the halving cycle Bitcoin is currently? In this article, we will penetrate the market noise and analyze a series of key on-chain indicators and macroeconomic signals to determine whether the Bitcoin bull market is still sustainable, or is it about to face a deeper correction?

Healthy correction or the end of the bull market?

An ideal entry point is the MVRV-Z indicator. This long-standing valuation indicator measures the status of assets by comparing the market value of cryptocurrencies to their realized value. When the value fell from a peak of 3.36 to around 1.43, the price of Bitcoin fell from a high of nearly $100,000 to a staged low of $75,000. Intuitively, such a 30% price correction is indeed quite drastic.

From 100,000 to 75,000: The cyclical truth behind the deep correction and the signal of bull market restart​

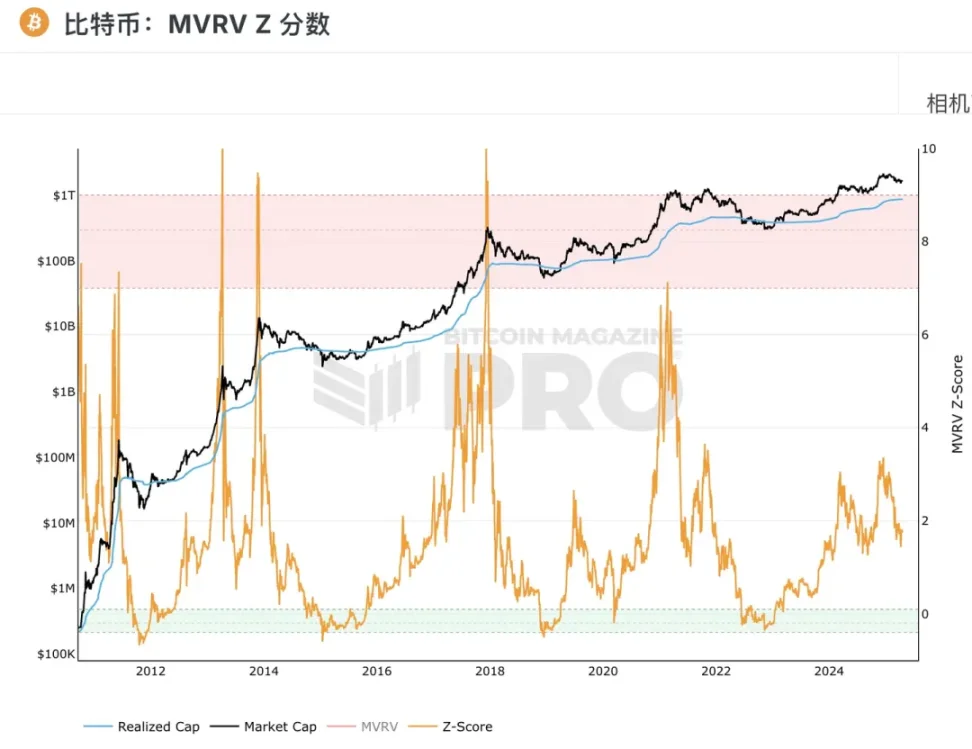
 Figure 1: Recently, the MVRV Z-Score has rebounded from the 2025 low of 1.43

Historically, the current MVRV-Z level has tended to mark local bottoms rather than tops. Similar pullbacks have occurred in past cycles, such as 2017 and 2021, before BTC prices resumed their upward trend. In short, while this decline has shaken investor confidence, it is essentially consistent with historical corrections in bull cycles.

Follow the smart money

Another key indicator is the Value Days Destroyed (VDD) multiple. This metric measures the speed of on-chain transfers by weighting the time Bitcoin is held before being traded. When the multiple soars, it usually means that experienced holders are taking profits; if it remains low for a long time, it may indicate that the market is in an accumulation phase.

Currently, the indicator is deep in the "green zone", with levels similar to the late bear market or early recovery stages. As BTC prices have reversed sharply from above $100,000, we may be witnessing the end of the profit-taking wave, while some long-term accumulation behavior has become more apparent, indicating that participants are positioning themselves for future price increases.

From 100,000 to 75,000: The cyclical truth behind the deep correction and the signal of bull market restart​

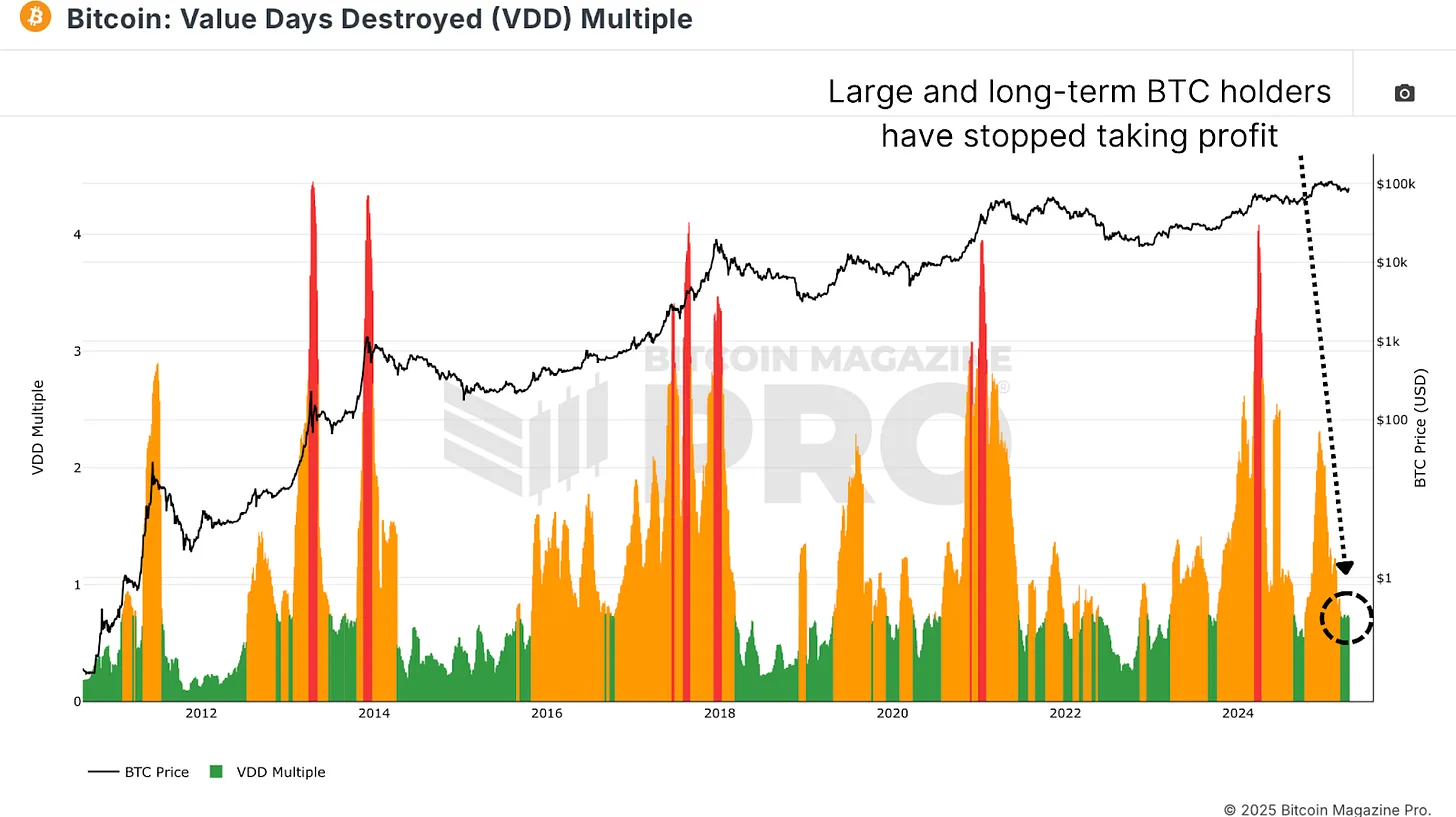
 Figure 2: Current VDD multiples suggest long-term holders are in an accumulation phase

One of the most insightful on-chain indicators is the Bitcoin Cycle Capital Flow Chart, which breaks down realized capital by coin age, isolating different groups such as new entrants (holding time < 1 month) and medium-term holders (1-2 years) to observe the capital migration path. The red band (new entrants) rose sharply near the historical high of $106,000, indicating that a large amount of panic buying driven by FOMO sentiment occurred at the top of the market at that time. Since then, the activity of this group has cooled significantly, falling back to a level consistent with the early to mid-stage bull market.

On the contrary, the group that has held tokens for 1-2 years (usually accumulators with macro insights) has resumed the trend of increasing holdings. This inverse correlation reveals the core logic of market operation: when long-term holders accumulate chips at the bottom, new investors are often experiencing panic selling or choosing to leave. This pattern of capital flow, which increases and decreases, is highly consistent with the "accumulation-distribution" law presented in the complete bull market cycle from 2020 to 2021, reproducing the typical characteristics of the historical cycle.

From 100,000 to 75,000: The cyclical truth behind the deep correction and the signal of bull market restart​

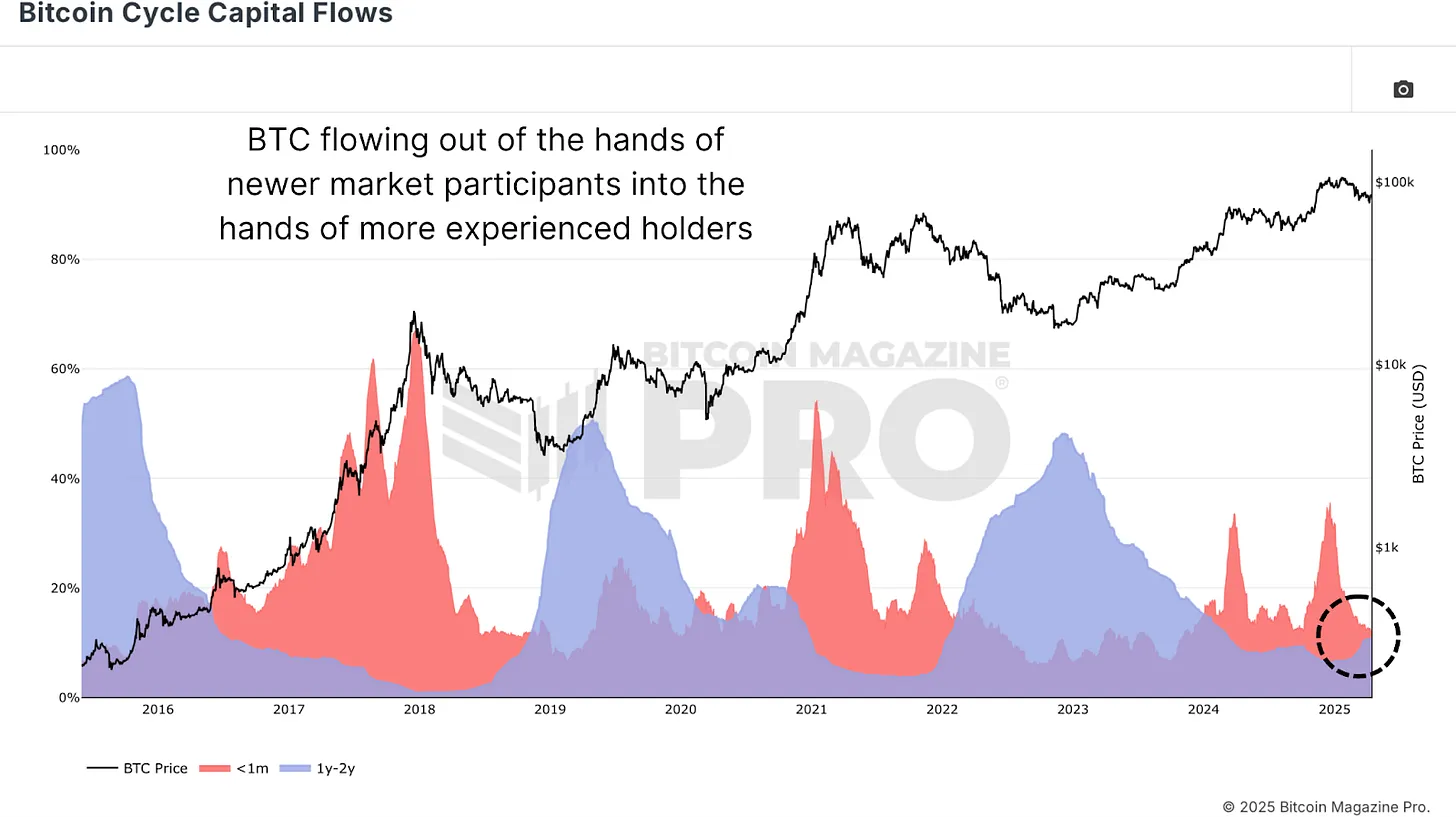
 Figure 3: Bitcoin Cycle Capital Flow Chart Shows BTC Flowing Back to More Experienced Holders

What stage are we at now?

From a macro perspective, we divide the Bitcoin market cycle into three key stages:

  1. Bear market stage: deep correction (70-90%)
  2. Recovery phase: Recovering historical highs
  3. Bull market growth stage: Parabolic rise after breaking through the previous high

The bear markets in 2015 and 2018 lasted about 13-14 months, respectively. Our most recent bear market cycle also lasted 14 months. The market recovery phase in historical cycles generally takes 23 to 26 months, and we are currently within this typical recovery time window.

From 100,000 to 75,000: The cyclical truth behind the deep correction and the signal of bull market restart​

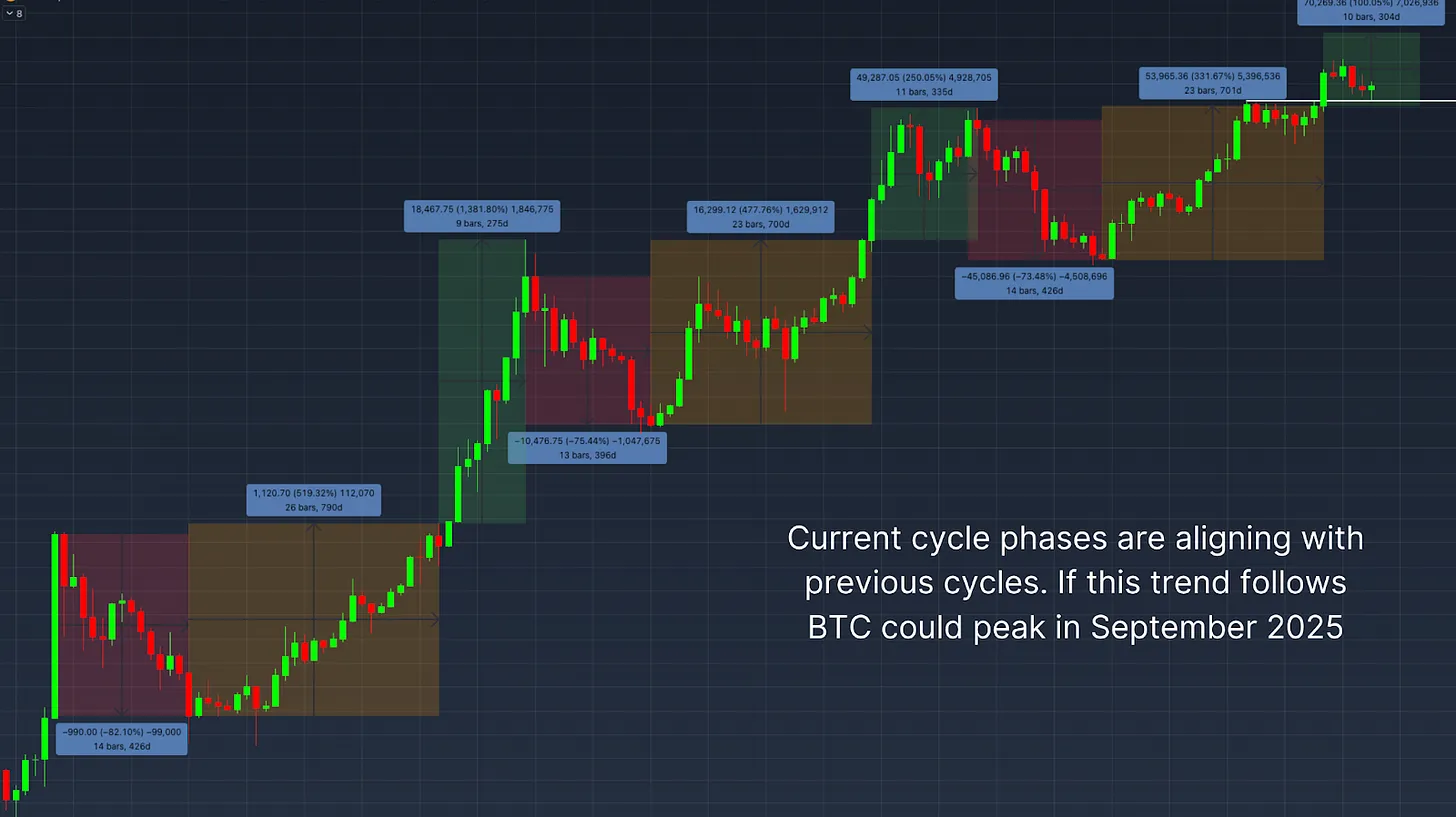
 Figure 4: Using historical cycle trends to predict potential bull market peaks

However, the performance of this bull phase is somewhat abnormal. Bitcoin did not immediately surge after breaking through the historical high, but instead experienced a pullback. This may mean that the market is building a higher low before entering a steeper upward channel in the exponential growth phase. If we use the average length of the 9-month and 11-month exponential phases in the past cycles as a reference, assuming that the bull market can continue, we expect the potential top of this cycle to appear around September 2025.

Macro risks

Despite the encouraging on-chain data, macro headwinds remain. Analysis of the S&P 500 and Bitcoin correlation charts shows that Bitcoin remains highly correlated with the U.S. stock market. Continued weakness in traditional markets could impact Bitcoin’s ability to rebound in the short term as concerns grow over a potential global recession.

From 100,000 to 75,000: The cyclical truth behind the deep correction and the signal of bull market restart​

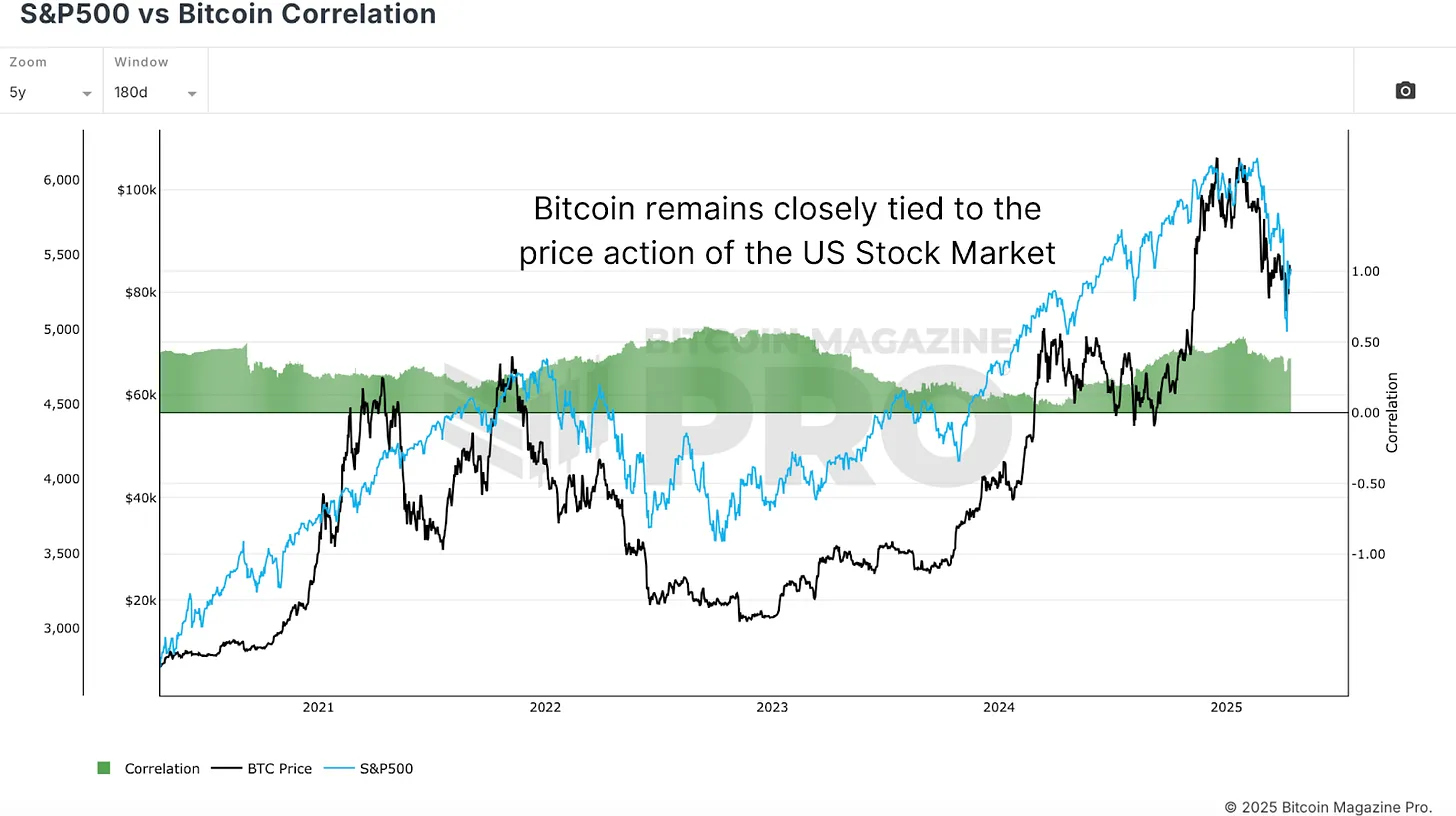
 Figure 5: Bitcoin Correlation with US Stocks

in conclusion

As we have seen in our analysis, key on-chain indicators such as MVRV Z-score, Value Days Destroyed, and Bitcoin Cycle Funds Flows indicate that the market is showing healthy cyclical trends and showing signs of continued accumulation by long-term holders. However, there are still significant macroeconomic uncertainties in the market, and these are key risks that need to be closely monitored.

This cycle is slower and more volatile than previous ones, but it has not broken the historical structural pattern. Bitcoin seems to be ready to rise again, and if there is no further deterioration in traditional markets, it may reach a new peak in the third quarter or early fourth quarter.

Market Opportunity
Movement Logo
Movement Price(MOVE)
$0.02375
$0.02375$0.02375
+1.10%
USD
Movement (MOVE) Live Price Chart
Disclaimer: The articles reposted on this site are sourced from public platforms and are provided for informational purposes only. They do not necessarily reflect the views of MEXC. All rights remain with the original authors. If you believe any content infringes on third-party rights, please contact service@support.mexc.com for removal. MEXC makes no guarantees regarding the accuracy, completeness, or timeliness of the content and is not responsible for any actions taken based on the information provided. The content does not constitute financial, legal, or other professional advice, nor should it be considered a recommendation or endorsement by MEXC.

You May Also Like

Cashing In On University Patents Means Giving Up On Our Innovation Future

Cashing In On University Patents Means Giving Up On Our Innovation Future

The post Cashing In On University Patents Means Giving Up On Our Innovation Future appeared on BitcoinEthereumNews.com. “It’s a raid on American innovation that would deliver pennies to the Treasury while kneecapping the very engine of our economic and medical progress,” writes Pipes. Getty Images Washington is addicted to taxing success. Now, Commerce Secretary Howard Lutnick is floating a plan to skim half the patent earnings from inventions developed at universities with federal funding. It’s being sold as a way to shore up programs like Social Security. In reality, it’s a raid on American innovation that would deliver pennies to the Treasury while kneecapping the very engine of our economic and medical progress. Yes, taxpayer dollars support early-stage research. But the real payoff comes later—in the jobs created, cures discovered, and industries launched when universities and private industry turn those discoveries into real products. By comparison, the sums at stake in patent licensing are trivial. Universities collectively earn only about $3.6 billion annually in patent income—less than the federal government spends on Social Security in a single day. Even confiscating half would barely register against a $6 trillion federal budget. And yet the damage from such a policy would be anything but trivial. The true return on taxpayer investment isn’t in licensing checks sent to Washington, but in the downstream economic activity that federally supported research unleashes. Thanks to the bipartisan Bayh-Dole Act of 1980, universities and private industry have powerful incentives to translate early-stage discoveries into real-world products. Before Bayh-Dole, the government hoarded patents from federally funded research, and fewer than 5% were ever licensed. Once universities could own and license their own inventions, innovation exploded. The result has been one of the best returns on investment in government history. Since 1996, university research has added nearly $2 trillion to U.S. industrial output, supported 6.5 million jobs, and launched more than 19,000 startups. Those companies pay…
Share
BitcoinEthereumNews2025/09/18 03:26
China Blocks Nvidia’s RTX Pro 6000D as Local Chips Rise

China Blocks Nvidia’s RTX Pro 6000D as Local Chips Rise

The post China Blocks Nvidia’s RTX Pro 6000D as Local Chips Rise appeared on BitcoinEthereumNews.com. China Blocks Nvidia’s RTX Pro 6000D as Local Chips Rise China’s internet regulator has ordered the country’s biggest technology firms, including Alibaba and ByteDance, to stop purchasing Nvidia’s RTX Pro 6000D GPUs. According to the Financial Times, the move shuts down the last major channel for mass supplies of American chips to the Chinese market. Why Beijing Halted Nvidia Purchases Chinese companies had planned to buy tens of thousands of RTX Pro 6000D accelerators and had already begun testing them in servers. But regulators intervened, halting the purchases and signaling stricter controls than earlier measures placed on Nvidia’s H20 chip. Image: Nvidia An audit compared Huawei and Cambricon processors, along with chips developed by Alibaba and Baidu, against Nvidia’s export-approved products. Regulators concluded that Chinese chips had reached performance levels comparable to the restricted U.S. models. This assessment pushed authorities to advise firms to rely more heavily on domestic processors, further tightening Nvidia’s already limited position in China. China’s Drive Toward Tech Independence The decision highlights Beijing’s focus on import substitution — developing self-sufficient chip production to reduce reliance on U.S. supplies. “The signal is now clear: all attention is focused on building a domestic ecosystem,” said a representative of a leading Chinese tech company. Nvidia had unveiled the RTX Pro 6000D in July 2025 during CEO Jensen Huang’s visit to Beijing, in an attempt to keep a foothold in China after Washington restricted exports of its most advanced chips. But momentum is shifting. Industry sources told the Financial Times that Chinese manufacturers plan to triple AI chip production next year to meet growing demand. They believe “domestic supply will now be sufficient without Nvidia.” What It Means for the Future With Huawei, Cambricon, Alibaba, and Baidu stepping up, China is positioning itself for long-term technological independence. Nvidia, meanwhile, faces…
Share
BitcoinEthereumNews2025/09/18 01:37
Silver Price Crash Is Over “For Real This Time,” Analyst Predicts a Surge Back Above $90

Silver Price Crash Is Over “For Real This Time,” Analyst Predicts a Surge Back Above $90

Silver has been taking a beating lately, and the Silver price hasn’t exactly been acting like a safe haven. After running up into the highs, the whole move reversed
Share
Captainaltcoin2026/02/07 03:15