

Capital Rotation Intensifies As Bitcoin Lags Gold and US Equities
Gold continues to surge to new highs while Bitcoin struggles to reclaim higher price levels, reinforcing a growing divergence across global markets. According to a recent CryptoQuant report, the current investment landscape has become a tale of two worlds.
On one side, precious metals and US equities are attracting consistent inflows as investors seek assets with clearer momentum and perceived stability. On the other hand, Bitcoin is showing signs of fatigue, with on-chain data signaling that the market is losing strength rather than preparing for an immediate recovery.
CryptoQuant highlights a concerning confluence of indicators that suggests the crypto market is entering a more fragile phase. While price remains relatively elevated compared to historical bear market levels, underlying metrics point to weakening demand and diminishing participation from key market segments. This disconnect implies that Bitcoin’s struggle is not purely technical, but structural, rooted in shifting capital preferences and risk appetite.
The contrast is striking. As gold benefits from macro uncertainty and equity markets push higher on liquidity expectations, Bitcoin appears caught in consolidation, unable to attract the same conviction-driven flows. This growing divergence raises important questions about Bitcoin’s role in the current cycle and whether it can reassert itself as a competitive asset amid tightening conditions and changing investor behavior.
Institutional Exodus and Shrinking Liquidity Pressure
The report points to a clear institutional retreat that is weighing heavily on Bitcoin’s market structure. The Coinbase Premium Index, a key proxy for US institutional demand, remains deeply negative and recently reached a periodic low of -0.169%. This signals that selling pressure during US trading hours is materially stronger than the global average.
Notably, the index has turned positive only twice throughout January, reinforcing the view that institutions and high-net-worth participants are actively deleveraging rather than accumulating exposure. Historically, sustained negative premiums of this magnitude tend to coincide with phases of distribution, not early-stage recoveries.

Compounding this weakness is the evaporation of market “dry powder.” The combined market capitalization of the top 12 stablecoins has contracted by $2.24 billion recently, extending a peak-to-trough decline of roughly $5.6 billion.
This behavior differs from the typical rotation into stablecoins seen ahead of dip-buying phases. Instead, it reflects a more concerning dynamic: capital exiting the crypto ecosystem entirely and moving back into fiat. Without sidelined liquidity ready to re-enter, upside reactions become structurally weaker and short-lived.
Caught between institutional selling and shrinking liquidity, Bitcoin’s near-term bias remains skewed to the downside. In a bearish scenario, key levels to monitor include the True Mean Price near $81,000, the 2024 high around $70,000, and ultimately the 200-week moving average near $58,000.
Conversely, a bullish outcome would likely require an extended period of sideways consolidation, allowing overhead supply to be absorbed while stablecoin inflows recover and fresh capital gradually returns.
Bitcoin Remains Trapped Below Key Moving Averages
Bitcoin continues to trade under pressure, with the price hovering near the $88,000 area after failing to reclaim higher resistance levels. The chart shows a clear sequence of lower highs since the October peak near $125,000, confirming that the broader structure has shifted from trend continuation to distribution and consolidation. Each recovery attempt has been capped below descending moving averages, reinforcing the loss of upside momentum.
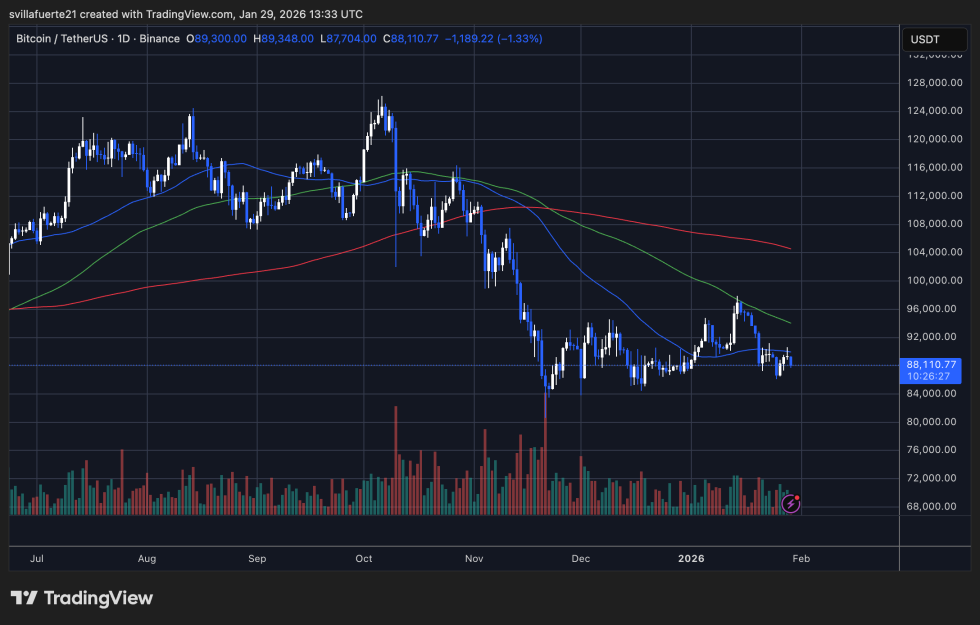
Price remains below the 50-day and 100-day moving averages, both of which are now sloping downward and acting as dynamic resistance around the $95,000–$98,000 zone. The 200-day moving average sits higher, near the $105,000 area, and continues to define the long-term trend boundary. As long as BTC trades below these levels, rallies are likely to be corrective rather than impulsive.
On the downside, the $85,000–$87,000 region has emerged as an important short-term support, coinciding with recent consolidation lows. The sharp sell-off in November, followed by a high-volume bounce, suggests forced deleveraging rather than organic accumulation. Since then, volume has steadily declined, pointing to reduced participation and a lack of strong directional conviction.
Bitcoin appears locked in a compression phase. Without a decisive reclaim of the mid-range moving averages, the risk remains skewed toward further downside tests. Conversely, sustained acceptance above $95,000 would be required to shift the short-term bias back toward stabilization rather than continuation of the corrective trend.
Featured image from ChatGPT, chart from TradingView.com


You May Also Like

Nvidia (NVDA) Earnings, Treasury Yields, and Retail Reports Highlight This Week’s Market Focus
Jump Crypto Quietly Launches Firedancer on Solana Mainnet


