

SUI Takes a 6% Hit: Temporary Bear Trap or Full-On Bearish Breakout?
- SUI has lost over 6% and is trading at $1.28.
- Its daily trading volume has increased by 73%.
Fear continues to weigh on the broader market, which is down 5.51%. The red charts of the crypto assets convey that they are losing momentum. The largest asset, Bitcoin (BTC), fell and currently hovers at $82.3K, while the largest altcoin, Ethereum (ETH), trades around $2.7K. Among the altcoin pack, SUI has registered a steady loss in value of over 6.32%.
The asset kicked off the day trading at a high of $1.37. Suddenly, the momentum was picked up by the bears, and the price fell to a low of $1.26. At the time of writing, SUI traded within the $1.28 mark, with its daily trading volume having increased by over 73.17%, reaching $1.21 billion. As per Coinglass data, the SUI market has seen a 24-hour liquidation of $7.41 million.
With the active bearish pressure, the SUI price could retrace to the nearest support at around $1.22. A break below this range might strengthen the bears potentially, and invite the death cross to take place, likely driving the asset’s price below $1.16.
If SUI turned the momentum bullish, the price might rise and hit the key $1.34 resistance. Upon the altcoin gaining more traction and breaking past this level, the bulls could trigger the golden cross to unfold and direct the price toward $1.40 or even higher.
SUI Technical Indicators Point to Growing Bearish Momentum
The technical chart analysis of SUI exhibits that both the Moving Average Convergence Divergence (MACD) and signal lines are settled below the zero line. This indicates that the bearish momentum dominates and shows the underlying weakness.
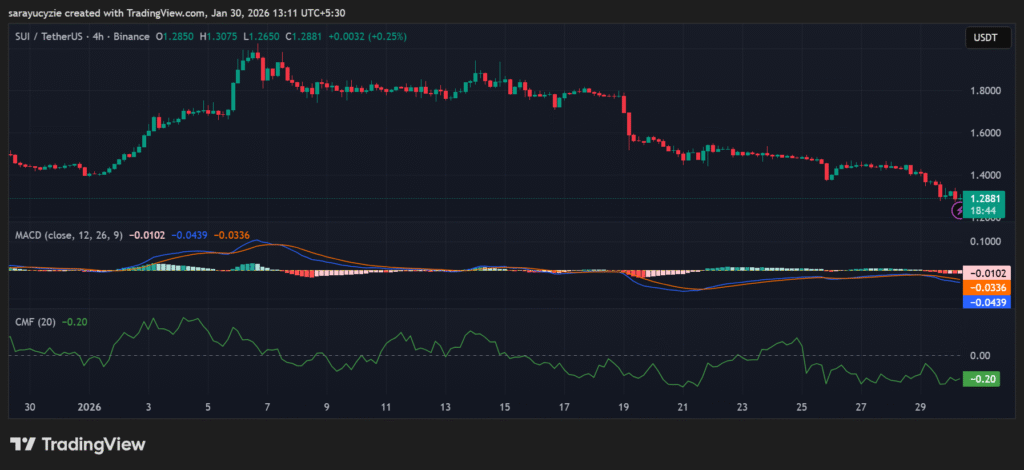 SUI chart (Source: TradingView)
Moreover, the Chaikin Money Flow (CMF) indicator stationed at 0.20 suggests strong capital outflows, with the sellers firmly in control. Notably, the distribution reigns accumulation, and reinforces a bearish bias if the price lacks further support.
SUI’s Bull Bear Power (BBP) reading found at -0.1210 implies that the bears have the upper hand. The price is trading slightly below the equilibrium, which hints at a mild downtrend. As it is not extreme, the ongoing momentum is weak. Significantly, the daily Relative Strength Index (RSI) staying at 26.34 signals the asset’s oversold condition. With this, the current bearish trend is strong, but the sellers may be nearing exhaustion.
Top Updated Crypto News
BNB Prints Red Candles: Is a Heavy Breakdown Risk Ahead or a Breather Before a Bounce?


You May Also Like

Trump biographer predicts next 3 Cabinet members on the chopping block

Kalshi hires ex-Democratic strategist amid legal troubles


