Solana prezzo oggi: SOL under pressure as intraday buyers test a bounce

In a crypto market dominated by fear and defensive positioning, Solana prezzo oggi is attempting to stabilize while its broader trend remains clearly bearish.
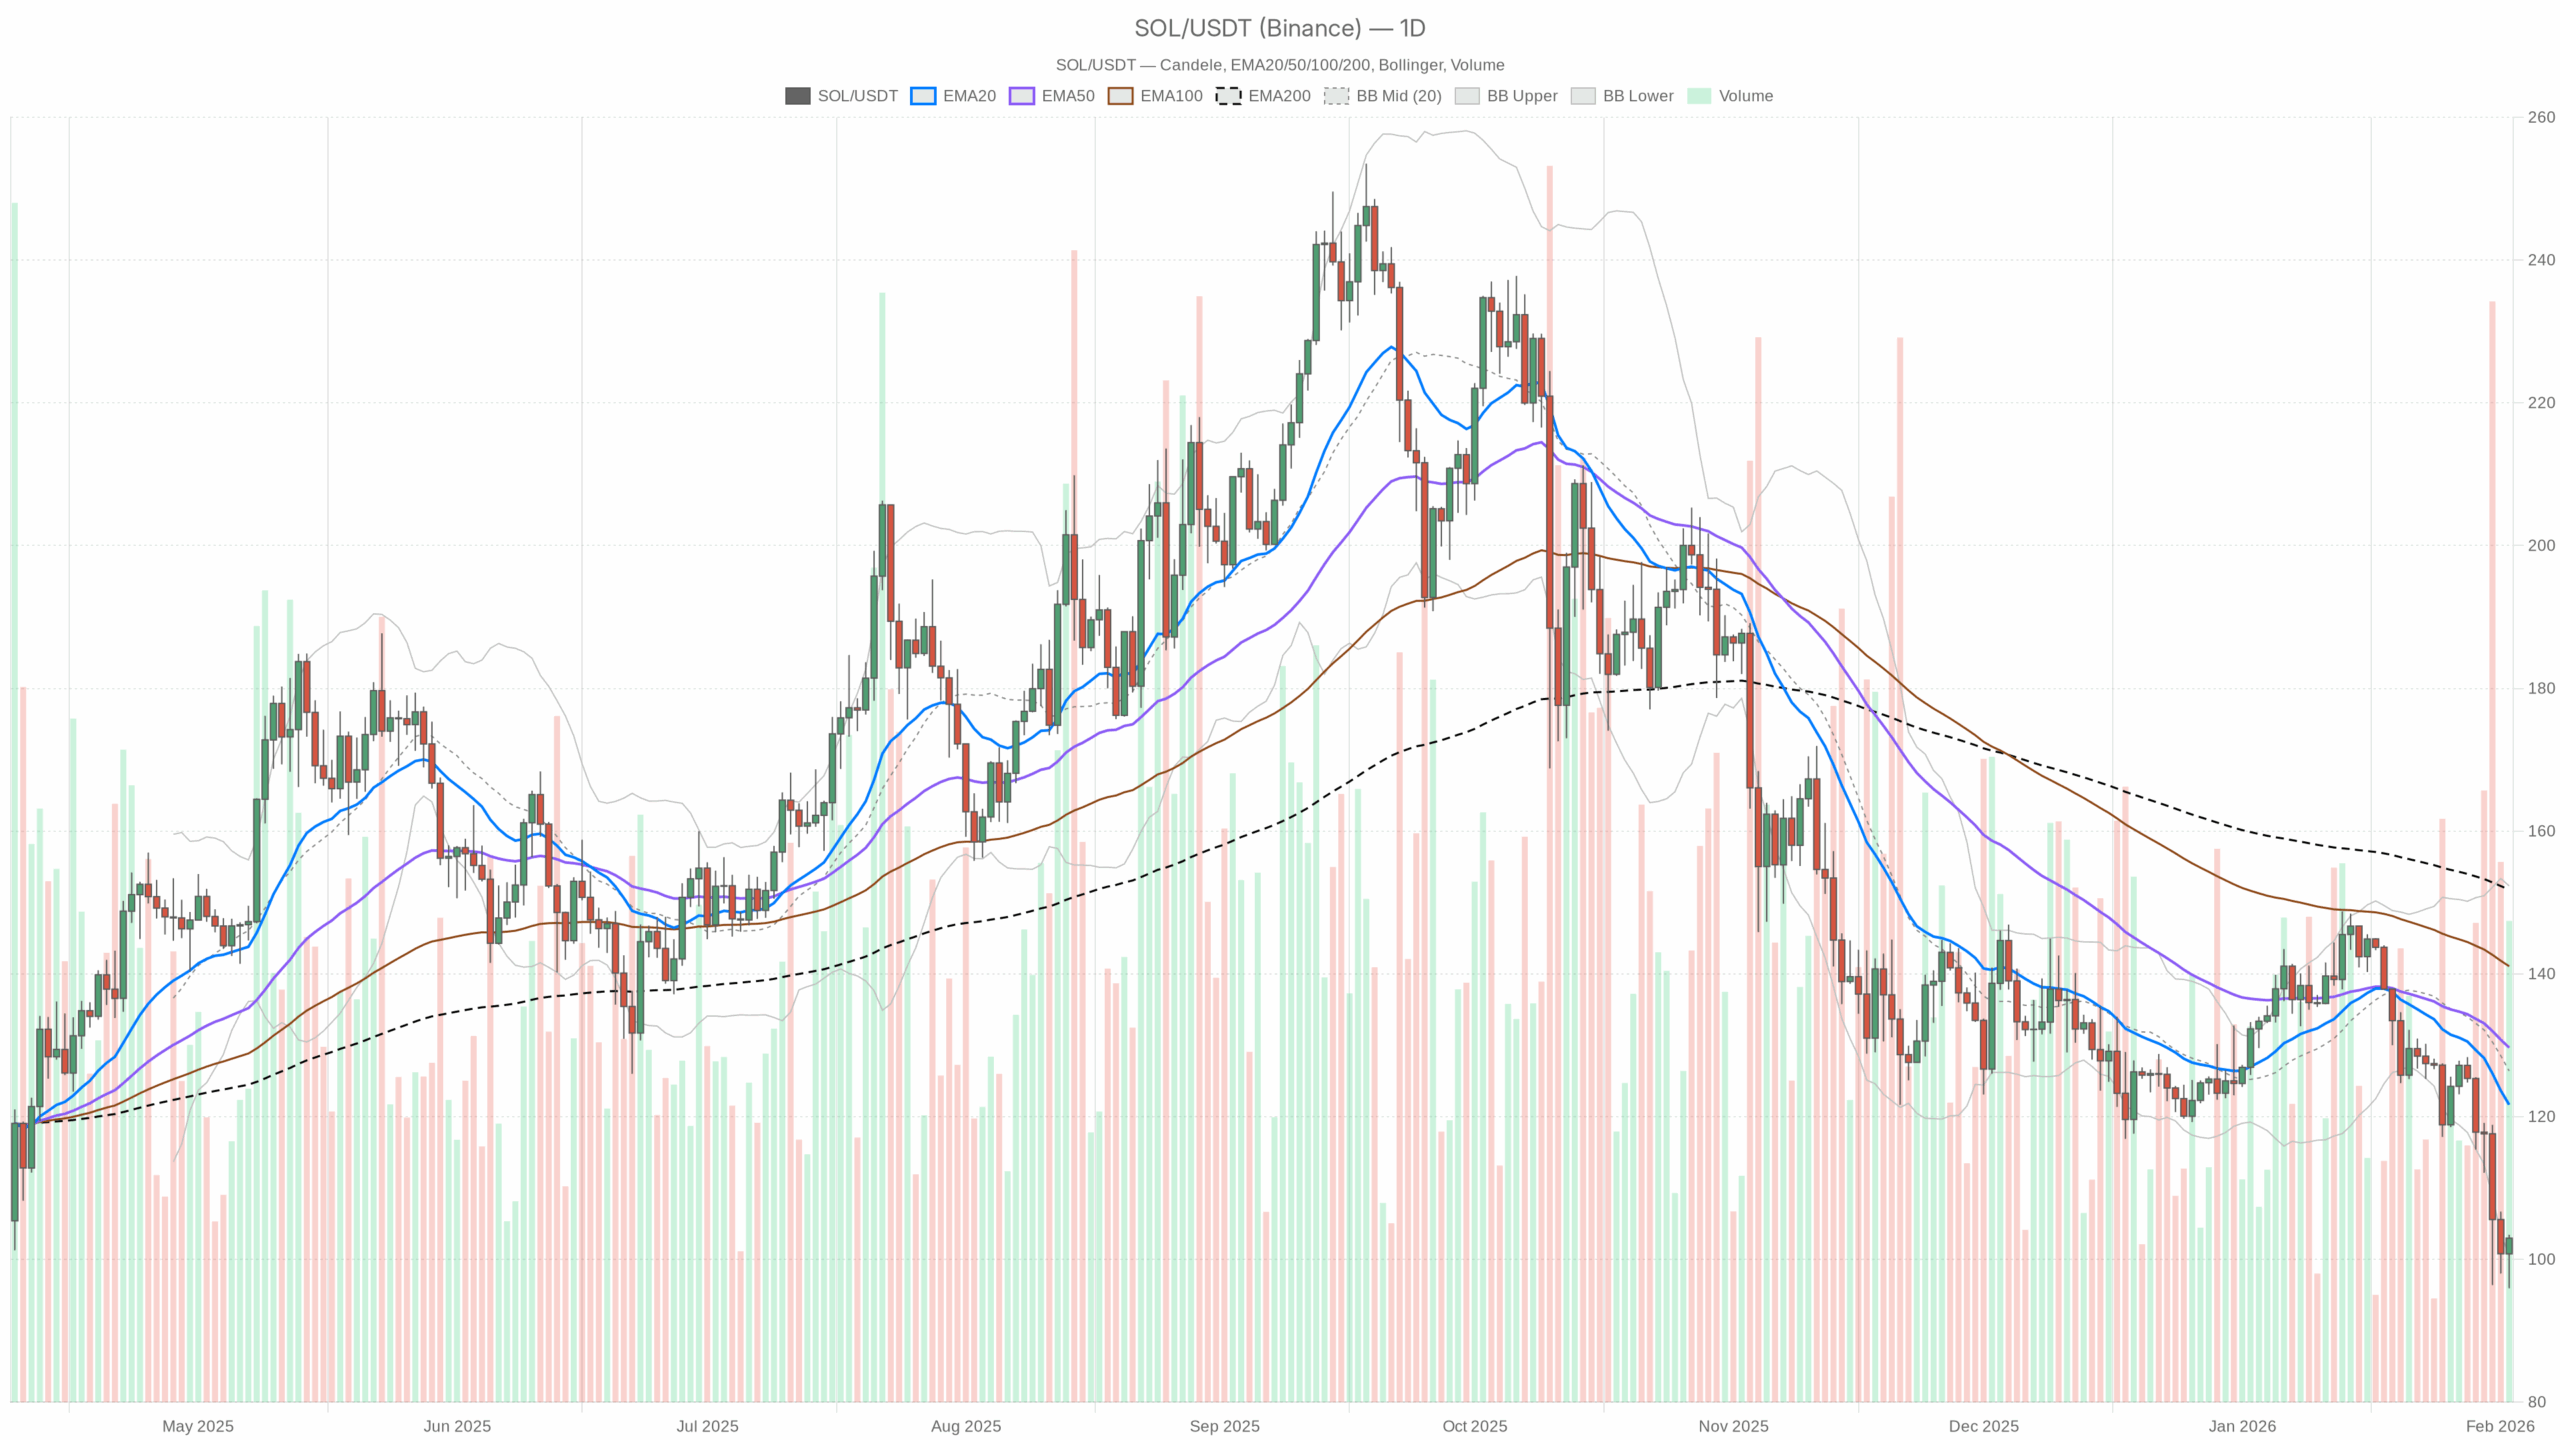 SOL/USDT — daily chart with candlesticks, EMA20/EMA50 and volume.
Daily bias: bearish backdrop with oversold conditions
On the daily timeframe (D1), the regime is clearly marked as bearish. Price at about $102.97 is trading well below all key moving averages and beneath the mid-line of the Bollinger Bands. The structure is that of a downtrend, not just a pullback inside a bull move.
EMAs (trend structure – D1)
– EMA20: 121.67
– EMA50: 129.67
– EMA200: 151.81
Price is roughly $19 below the 20-day EMA, nearly $27 below the 50-day, and almost $49 under the 200-day EMA. All three EMAs are stacked above price and pointing down, which signals a mature downtrend rather than a shallow correction. For swing traders, this is still a “sell the bounce” environment until price can at least reclaim the 20-day EMA and hold above it. The distance from the 200-day also shows that longer-term trend followers remain in control on the downside.
RSI 14 (momentum – D1)
– RSI (14): 28.72
RSI sitting below 30 puts Solana in oversold territory on the daily. That often aligns with late-stage legs of a selloff where downside fuel starts to thin out. It does not guarantee a bottom, but it increases the risk of sharp mean-reversion bounces if sellers get crowded. In practical terms, momentum is negative but stretched; chasing fresh shorts here on the daily becomes progressively less attractive unless the market cracks key levels with strong volume.
MACD (trend momentum – D1)
– MACD line: -7.26
– Signal line: -4.18
– Histogram: -3.08
The MACD line is below the signal and both are in negative territory, confirming downtrend momentum. The histogram is solidly negative, so the downside push is still present. However, when MACD is this far underwater while RSI is oversold, you are often closer to a reaction move (a bounce or consolidation) than the start of a brand-new collapse. Bears are in control, but the risk-reward is not as one-sided as it was earlier in the move.
Bollinger Bands (volatility & mean – D1)
– Middle band (20-day basis): 126.39
– Upper band: 152.31
– Lower band: 100.47
– Price: 102.97
Solana is hovering just above the lower Bollinger Band, with the middle band far above current price. That shows price has traveled to the lower edge of its recent volatility range and is trying to stabilize there. When price hugs the lower band, it confirms the downtrend. However, proximity to the band also means the immediate downside is limited by prior volatility. Any strong daily close back toward the middle band would mark a shift toward mean reversion, while a clean breakdown below the lower band would signal a fresh volatility expansion lower.
ATR 14 (volatility – D1)
– ATR (14): 7.77
An average true range of roughly $7.8 means daily swings of around 7–8% relative to current price, which is elevated but not extreme for Solana. Volatility is high enough that levels get tested quickly, but not at capitulation levels. From a risk standpoint, this implies wider stops and smaller position sizes are needed to survive routine daily noise.
Pivot levels (reference levels – D1)
– Pivot point (PP): 100.79
– Resistance 1 (R1): 105.63
– Support 1 (S1): 98.13
Price is trading just above the daily pivot at $100.79, leaning closer to R1 at $105.63 than to S1. This tells you we are in a tactical bounce zone inside a broader downtrend. Holding above the pivot keeps the door open for a test of R1 and maybe higher intraday resistances. Losing the pivot and then S1 would reinforce the idea that the daily downtrend still has room to run.
Intraday picture: stabilization, not a confirmed reversal
1-hour chart (H1): neutral with a constructive tilt
– Price: 102.99
– EMA20: 102.02
– EMA50: 105.12
– EMA200: 115.30
– RSI (14): 51.6
– MACD histogram: 0.48
– Bollinger mid: 101.49 (bands 99.22 – 103.75)
– ATR (14): 2.62
– H1 pivot: 103.02 (R1 103.42, S1 102.59)
On the hourly, the regime is marked neutral. Price is just above the 20-EMA, but still below the 50-EMA and far below the 200-EMA. That is typical of a market in the early stages of a potential rebound inside a dominant downtrend. Short-term buyers are defending dips, but they have not flipped the structure yet.
RSI around 52 shows balanced momentum, no longer oversold intraday. Moreover, the MACD histogram turning slightly positive hints that short-term momentum has shifted in favor of the bulls for now, but it is a modest edge, not a runaway uptrend.
Price is hovering near the hourly pivot at $103.02, slightly under R1 at $103.42 and above S1 at $102.59. That is classic consolidation behavior: the market is probing both sides of the range without a decisive break. ATR at $2.62 underlines that intraday swings of 2–3% are normal right now. These are enough to shake out tight stops but not a sign of panic.
15-minute chart (M15): short-term bounce, still within bigger downtrend
– Price: 102.99
– EMA20: 101.92
– EMA50: 101.52
– EMA200: 104.86
– RSI (14): 60.63
– MACD histogram: 0.16
– Bollinger mid: 101.67 (bands 99.27 – 104.07)
– ATR (14): 0.74
– M15 pivot: 102.87 (R1 103.13, S1 102.74)
On the 15-minute chart, Solana is in a tactical up-phase. Price is above both the 20- and 50-EMAs, with RSI around 61, showing mild bullish momentum. MACD is slightly positive, supporting the idea of intraday dip buying.
However, the 200-EMA at $104.86 sits above price and acts as a cap for now. That is the line between a simple intraday bounce and a more convincing short-term trend change. As long as price stays below that 200-EMA on M15, this move is best viewed as a relief bounce within a bigger, still-bearish daily context.
The 15-minute pivot at $102.87 has been reclaimed and is now acting as short-term support, with R1 at $103.13 just overhead. Intraday players are effectively trading a tight range between 102.7–103.5, looking for a break that aligns with the hourly structure.
Broader context: Solana inside a fearful altcoin market
The dominant force at the moment is risk-off positioning in a crypto market gripped by Extreme Fear (index at 14) and a slightly shrinking total market cap. Bitcoin dominance above 57% shows capital hiding in the benchmark rather than rotating aggressively into altcoins like Solana. In other words, SOL is trying to find a floor in an environment that is not friendly to altcoin risk.
From a macro crypto perspective, Solana currently accounts for about 2.16% of total crypto market cap. BTC dominance above 57% and the Fear & Greed Index in Extreme Fear tell you what is going on: capital is defensive, preferring Bitcoin and stablecoins over high-beta altcoins. On top of that, total market cap is down roughly 1.2% over 24 hours, confirming a soft risk backdrop.
On-chain and DeFi activity on Solana remains non-trivial: protocols like Raydium, Orca, Meteora, SolFi are still generating notable fees, with some seeing strong 7–30 day growth. That is a reminder that the ecosystem is not dead. However, in the short term, price is trading macro sentiment, not fundamentals. For traders, that means respecting technical levels first and treating fundamental strength as a reason to watch for, not front-run, a reversal.
Main scenario for Solana prezzo oggi (D1-driven)
Given the daily structure, the primary bias is bearish with a growing risk of a countertrend bounce. D1 trend and MACD are still down, EMAs are all overhead, and price is trading near the lower Bollinger Band with an oversold RSI. That combination often precedes short-covering rallies, but those rallies typically run into heavy supply at the nearest EMAs and prior support zones turned resistance.
Bullish scenario
For bulls, the play here is mean reversion within a bearish trend:
– First step: Hold above the daily pivot at $100.79 and defend the $98–100 zone (around S1 and the lower Bollinger Band at $100.47). As long as this area holds on a closing basis, the market has a platform for a bounce.
– Near-term objective: Push toward and through $105–108, roughly aligning with intraday R1 levels and the top of the recent hourly range. That would confirm that the current intraday bounce has legs.
– Stronger confirmation: A daily close above the 20-day EMA at $121.67 would be the first serious sign that the downtrend is losing control. At that point, the target zone opens toward the 50-day EMA around $129–130 and the middle Bollinger Band at $126.39 as a natural magnet.
What invalidates the bullish scenario?
A decisive daily close below $98, extending away from the lower Bollinger Band, would show that demand failed even at oversold levels. Combined with RSI staying pinned under 30, that would indicate a fresh leg lower rather than a bounce, effectively sidelining the bullish mean-reversion thesis.
Bearish scenario
Bears still control the higher timeframe, and their base case is a continuation of the trend after a pause:
– Initial line in the sand: The $105–108 zone. As long as price remains below this pocket on a closing basis, rallies are just fuel for new shorts. This region aligns with short-term resistances and sits well below the 20-day EMA, keeping the bigger downtrend intact.
– Continuation trigger: A breakdown and sustained trading below $98 would likely trigger stops and pressure the market into a new search for support. With volatility (ATR) elevated, a break could extend quickly by another $7–10 over a few sessions.
– Downside focus: In that case, the market would be hunting for a new equilibrium below the current Bollinger Band structure, likely forcing RSI even deeper into oversold territory before any sustainable bottom-building process can begin.
What invalidates the bearish scenario?
If Solana reclaims and holds above the 20-day EMA (~$122) with daily closes, the character of this move changes. That would signal that sellers are losing follow-through and that the market is transitioning from a trending down move into a broader consolidation or even the early stages of a new uptrend. Bears would then need to reconsider, especially if RSI recovers above 40–50 and MACD starts to curl higher toward a potential cross.
How to think about positioning, risk, and uncertainty
Right now, timeframes are in tension: the daily chart is clearly bearish and oversold, while intraday charts (H1 and M15) are stabilizing and leaning slightly bullish. That typically leads to choppy conditions where countertrend trades can work, but only if risk is tightly managed and profit expectations are modest.
For directional traders, the key choices are:
– Do you trade the dominant daily downtrend and look for entries on bounces toward resistance?
– Or do you trade the oversold bounce on the long side, knowing you are going against the higher timeframe trend and must be quicker to take profits?
In both cases, volatility metrics (ATR) on each timeframe are your guide for position sizing and stop distance. Daily ATR near $7.8 and H1 ATR around $2.6 mean that tight stops inside normal noise will be punished. Sizing smaller and respecting structural levels (<$98 on the downside, >$122 on the upside for the bigger picture) is critical to avoid getting whipsawed by routine volatility.
Ultimately, Solana is sitting at an interesting but risky spot: late in a down-leg, in a fearful macro environment, with early signs of intraday stabilization. That combination can produce powerful short squeezes, but it can just as easily produce another flush if the broader crypto market takes another step down. The market is undecided; your risk management should not be.
If you want to monitor markets with professional charting tools and real-time data, you can open an account on Investing using our partner link:
Open your Investing.com account
This section contains a sponsored affiliate link. We may earn a commission at no additional cost to you.
Disclaimer: This analysis is for informational and educational purposes only and is not investment, financial, or trading advice. Markets are volatile and unpredictable; always do your own research and consider your risk tolerance before making any trading decisions.


You May Also Like

Bitcoin at Crucial Pivot Point, Here's Why Fed Can Tilt Balance

Teradyne (TER) Stock Surges 271% Ahead of Q1 Earnings: What Investors Should Watch