Can Ethereum Price Hold $2,000 Support or More Dip Incoming

Key Insights:
- Ethereum price fell to $2,156 before stabilizing near $2,329 on Feb. 2.
- Spot selling pressure dominated, while on-chain activity metrics diverged.
- Traders focused on the $2,000–$2,200 zone as the next directional trigger.
Ethereum (ETH) price dropped sharply on Feb. 2, 2026, after a late-session selloff across majors. ETH price printed a daily low near $2,156 on Bitstamp before bouncing modestly. TradingView data showed Ethereum price struggling to reclaim broken intraday levels.
The move mattered because Ethereum already traded near a widely watched support band. Market participants assessed whether on-chain signals could offset visible sell pressure. The debate intensified as the price hovered above the $2,000 handle.
Ethereum Price Tested a Widely Watched Support Zone
Ethereum price moved directly into the $2,000–$2,200 support area during the session. Crypto trader Ted Pillows warned that the zone represented a must-hold structure. He cautioned that a failure could reopen downside toward April 2025 lows.
 ETH/USD 1-day price chart. Source: TradingView
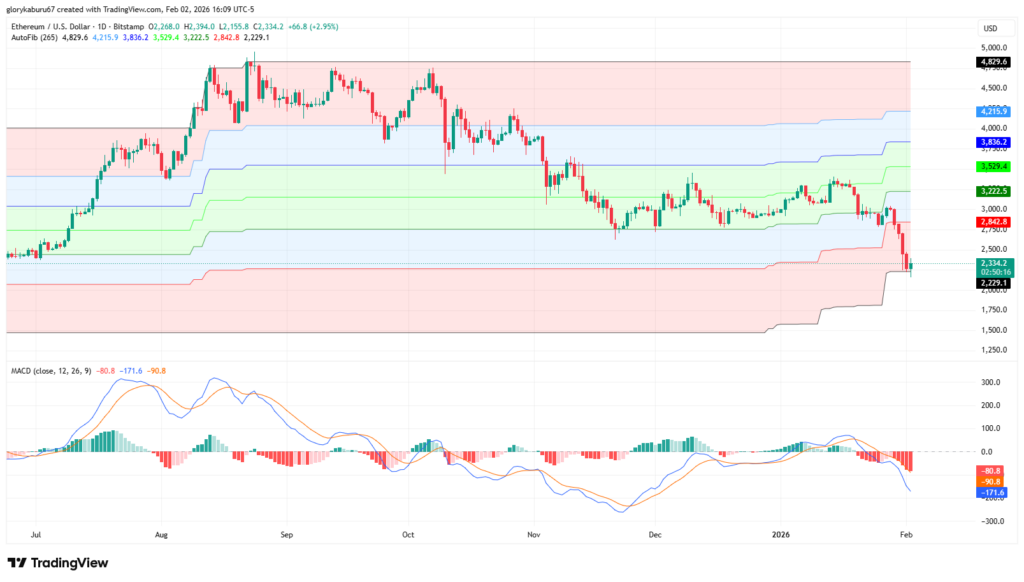
TradingView’s daily chart showed ETH price closing around $2,329 after the dip. The chart highlighted a lower reference near $2,229, aligning closely with the support band. The price briefly pierced that area before recovering slightly.
Overhead, TradingView levels clustered near $2,843 as the first resistance. Higher reference bands appeared around $3,223 and $3,529. Additional zones extended toward $3,836 and $4,216, with the upper range near $4,830.
Momentum indicators reinforced the defensive tone. The Moving Average Convergence Divergence (MACD) remained negative into early February. MACD readings hovered near -81, -90, and -172, reflecting persistent downside momentum after the breakdown.
Ethereum Price Faced Heavy Spot Selling Pressure
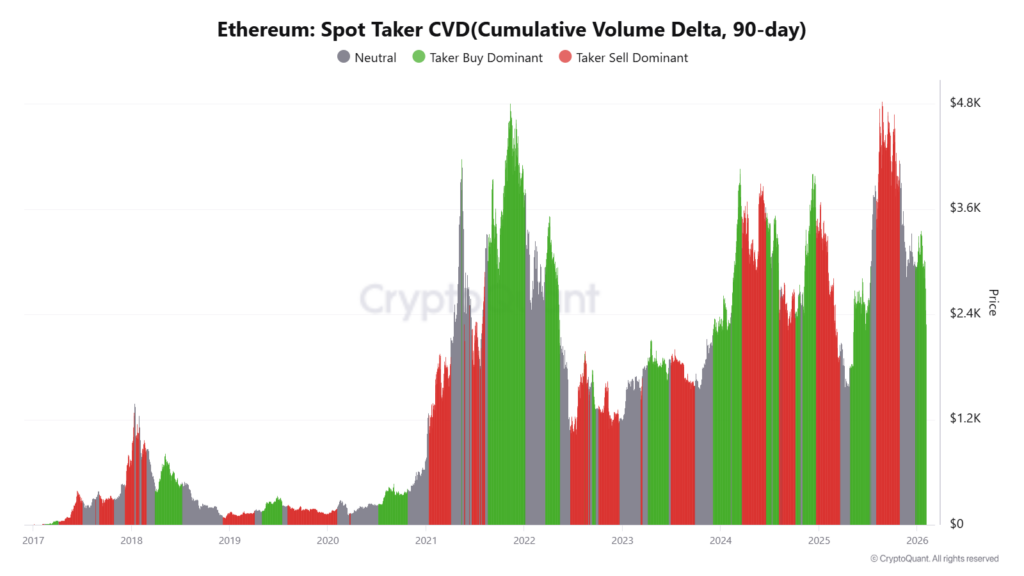
CryptoQuant’s 90-day spot taker cumulative volume delta showed sustained taker-sell dominance. Red phases expanded as Ethereum price rolled over into February. The data suggested market participants sold aggressively at market prices.
 Ethereum spot taker CVD | Source: CryptoQuant
Such behavior often amplifies volatility during thin liquidity periods. Sellers appeared unwilling to wait for limit fills, intensifying downward moves. The CVD pattern closely mirrored the sharp intraday wick on the daily chart.
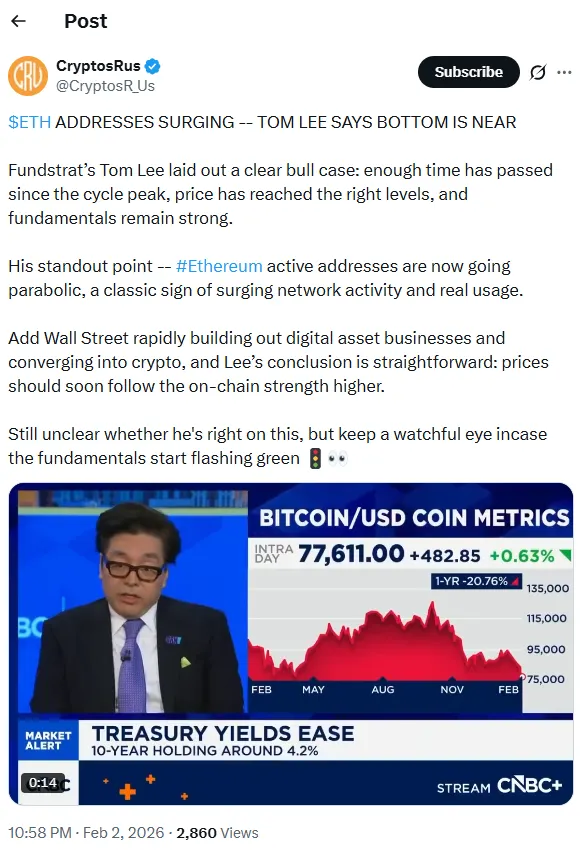
Fundstrat’s Tom Lee offered a contrasting view on ETH price direction. In comments shared by CryptosRus, Lee argued that enough time had passed since the prior cycle peak. He also said the price reached levels typically associated with bottoms.
 Tom Lee on Ethereum Price | Source X
Lee pointed to a surge in Ethereum active addresses as a supporting signal. He described address growth as parabolic, noting historical links between usage expansion and price recovery. The observation lacked precise figures, prompting traders to remain cautious.
The divergence stood out as Ethereum price slid while network activity appeared resilient. CryptoQuant’s CVD stayed negative even as address metrics strengthened. That mismatch left markets weighing structural usage against immediate selling pressure.
ETH Price Reflected Exchange Flows and Withdrawal Trends
CryptoQuant data on exchange withdrawing addresses showed elevated activity during volatile periods. The series spiked during past bull and bear cycles, then stayed active through 2024 and 2025. The trend suggested holders frequently moved Ether off exchanges during stress.
 Source: CryptoQuant
Rising withdrawal addresses often reduce near-term sell-side liquidity. Coins moved to self-custody typically remained unavailable for immediate spot selling. That dynamic sometimes softened drawdowns after sharp corrections.
Broader exchange flow data reinforced the risk-off environment. Analyst Crazzyblockk noted Bitcoin traded near $78,162 after a 13.2% decline over the past 30 days. He described the phase as a typical bearish correction marked by outflows.
Seven-day netflow metrics showed negative buying power across major venues. Binance averaged a -0.35 buying power ratio, while Coinbase posted -0.07 and OKX -0.10. The figures suggested capital retreated broadly during the correction.
 Source: CryptoQuant
Stablecoin movements added further context. Crazzyblockk reported withdrawal-to-deposit ratios of 1.74x on Binance, 3.28x on Coinbase Advanced, and 3.58x on OKX. He argued those ratios reflected stress rather than platform-specific issues.
While the data focused on Bitcoin and stablecoins, it shaped Ethereum price conditions. Elevated withdrawals and reduced deployable capital limited dip-buying capacity. That backdrop aligned with CryptoQuant’s sell-dominant CVD and Ether’s price weakness.
Near term, Ethereum crypto price direction hinged on the $2,000–$2,200 zone. A sustained hold could open a rebound toward $2,843 and $3,223, based on TradingView levels. A breakdown risked a deeper downside, as Ted Pillows warned.
Traders also monitored shifts in spot taker behavior and momentum indicators. A CVD flip toward buying and improving MACD readings could stabilize Ethereum price. Without those changes, rallies likely faced supply near former support.
The post Can Ethereum Price Hold $2,000 Support or More Dip Incoming appeared first on The Coin Republic.


You May Also Like

Tom Lee Predicts Ethereum Could Surge to $62,000 as Global Payment Infrastructure Evolves

BitGo Launches Revolutionary Institutional Stablecoin Service for Major Financial Players