

Solana Price Analysis: Wyckoff Spring Eyes $120 Liquidity Break
TLDR
- SOL prints a Wyckoff spring, reclaiming range support after a sell-side liquidity sweep.
- Liquidity heatmap shows $120 as a magnet, with stops and momentum clustered above.
- Weak follow-through selling suggests bearish momentum is fading after consolidation.
- Weekly demand near $120 remains critical for preserving Solana’s broader bullish cycle.
Solana (SOL) has entered a technically sensitive phase as recent price action signals a possible structural reset after a sharp corrective move. Multiple charts highlight a potential Wyckoff spring, tightening liquidity conditions, and a critical weekly demand test near $120. Together, these factors place Solana price at an inflection point that could define its next directional move.
Solana Price Reclaims Structure After Wyckoff Spring
According to analyst Ardi, Solana price recently printed a Wyckoff-style spring following a brief breakdown below range support. Price dipped beneath the consolidation range, triggering sell-side liquidity before quickly reclaiming the demand zone. This swift recovery suggests absorption of supply rather than sustained breakdown pressure.
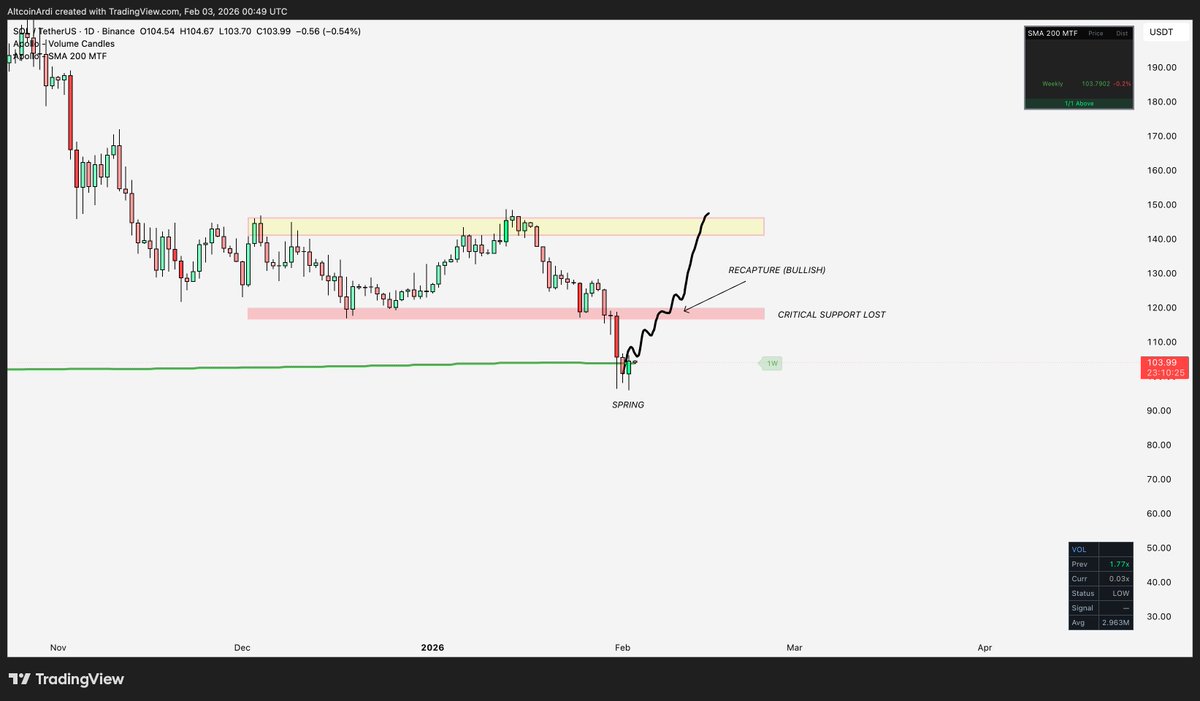
Most importantly, the reclaim is notable because it followed weeks of sideways consolidation. Such prolonged ranges often carry distribution risk, but the downside deviation altered that narrative. In Wyckoff terms, the behavior aligns with a Phase C spring transitioning toward a Phase D markup attempt.
Technically, the structure now depends on holding reclaimed support. As long as higher lows continue to form above the range floor, the setup favors continuation toward prior resistance. A failure to maintain this level would invalidate the spring thesis and restore downside risk.
Liquidity Heatmap Highlights $120 Resistance Magnet
Meanwhile, analyst CW focused on liquidity dynamics shaping near-term price behavior. The heatmap shows a dense liquidity band overhead, closely aligned with short-position resistance. Historically, Solana price tends to gravitate toward such zones once selling pressure fades.

Additionally, recent stabilization after the sell-off indicates that bearish momentum is weakening. Volatility compression near lower liquidity pockets often precedes expansion, as market makers rebalance exposure. The absence of aggressive follow-through selling suggests bears are struggling to extend control.
The analyst noted that a decisive break into higher liquidity could accelerate movement toward the $120 zone. Once price enters that band, stop triggers and momentum participation often reinforce continuation. Until resistance clears, however, rotational price action remains possible.
Weekly Demand Zone Tests Solana Price Cycle Strength
Furthermore, analyst Cyril-DeFi places current action within a broader weekly framework. Solana price has retraced into a long-standing demand zone near $120, a level that previously fueled major upside expansions. This zone represents both structural and psychological significance.SOURCE: X
Historically, elevated trading volume emerged whenever Solana price entered this zone. That behavior signals institutional interest rather than passive trading. Importantly, the pullback follows an extended uptrend, which aligns with healthy cycle behavior instead of trend failure.
From a macro standpoint, holding this demand preserves the bullish structure. A sustained weekly close below it would imply a deeper corrective phase. However, stabilization and higher lows here keep the probability tilted toward future expansion later in the cycle.
The post Solana Price Analysis: Wyckoff Spring Eyes $120 Liquidity Break appeared first on CoinCentral.


You May Also Like

Gold continues to hit new highs. How to invest in gold in the crypto market?

Trump’s gives away the game with claim voters don’t have 'appetite' for his war
Cango Inc. Completes $65M Investment and Secures $10M Convertible Note Financing


