

BNB Takes an 8% Knock: Is More Downside Risk Lurking, or Is a Dead-Cat Bounce Around the Corner?
- BNB is currently trading at $693, down over 8%.
- Daily trading volume has surged by more than 34%.
With a 6.63% drop in the market, sturdy red waves are rippling across the digital assets. The Fear and Greed Index value sits at 11, displaying extreme fear, and the prices are rolling downward. Both of the largest assets, Bitcoin and Ethereum, have tumbled by over 7% each. Meanwhile, BNB, the native token of the Binance ecosystem, has taken a solid hit, plunging by over 8.25%.
The asset opened the day trading at a high range of $763.90, and with the heavy bearish encounter in the BNB market, the price has slipped to a bottom level of $686.12. At the time of writing, BNB trades at around $693.90, and the trading volume surges by over 34.13% to $3.63 billion. In addition, the market has seen a 24-hour liquidation of $4.93 million worth of BNB.
Zooming in on the BNB/USDT trading pair, it gives a negative outlook, with the price retracing to the key support at around $680. If the bearish correction is extended, the bears might trigger the emergence of the death cross, which takes the asset’s price toward or below the $667.21 mark.
On the flip side, assuming the BNB momentum turned green, the price action could move up to the immediate resistance level at $706.35. With the bulls gaining more traction, the upside pressure invites the golden cross to unfold. Gradually, the price would rise toward $719.74 or even higher.
Bear Pressure Builds on BNB as Indicators Flash Warning Signs
BNB’s technical analysis reports that the Moving Average Convergence Divergence (MACD) and signal lines are found below the zero line, showing a strong bearish shift. It is trading lower than its average, and unless a bullish crossover occurs, the downside risk continues to remain.
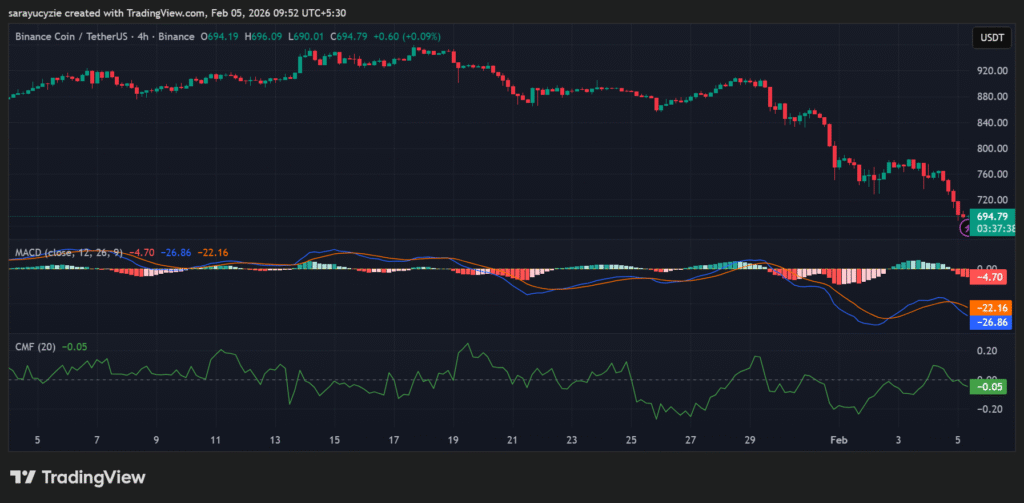 BNB chart (Source: TradingView)
In addition, the Chaikin Money Flow (CMF) indicator at -0.05 hints at mild selling pressure in the BNB market. The capital is briefly flowing out of the asset. As it is not an extreme bearish reading, it does reflect weak demand with a cautious sentiment rather than a strong accumulation.
The daily Relative Strength Index (RSI) resting at 22.73 indicates that BNB is deep in the oversold territory, with a strong bearish momentum. It likely raises the possibility of a short-term relief bounce. Moreover, the Bull Bear Power (BBP) reading of -79.15 suggests extreme bearish dominance. The price is trading below recent averages, reflecting aggressive selling pressure, and the broader bias stays strongly bearish unless momentum shifts.
Top Updated Crypto News
Bybit’s Mantle Vault Surpasses $150M AUM in Record Four-Week Growth


You May Also Like

A deep red state launched a surprising revolt against major conservative cause

Iran rules out direct US talks in Pakistan as envoys head to Islamabad


