PlanB, the pseudonymous analyst behind the stock-to-flow model, says bitcoin’s drawdown has left markets staring at four plausible bear-market paths, ranging fromPlanB, the pseudonymous analyst behind the stock-to-flow model, says bitcoin’s drawdown has left markets staring at four plausible bear-market paths, ranging from

PlanB Lays Out Four Bitcoin Bear-Market Scenarios

2026/02/05 20:30
4 min read

PlanB, the pseudonymous analyst behind the stock-to-flow model, says bitcoin’s drawdown has left markets staring at four plausible bear-market paths, ranging from a classic 80% drawdown to the possibility that the lows are already in.

In a post on X and a follow-up video dated Feb. 4, PlanB framed the debate around where bitcoin typically finds bear-market bottoms relative to long-term trend metrics, while also arguing that the previous rally’s lack of momentum could translate into a shallower reset this time.

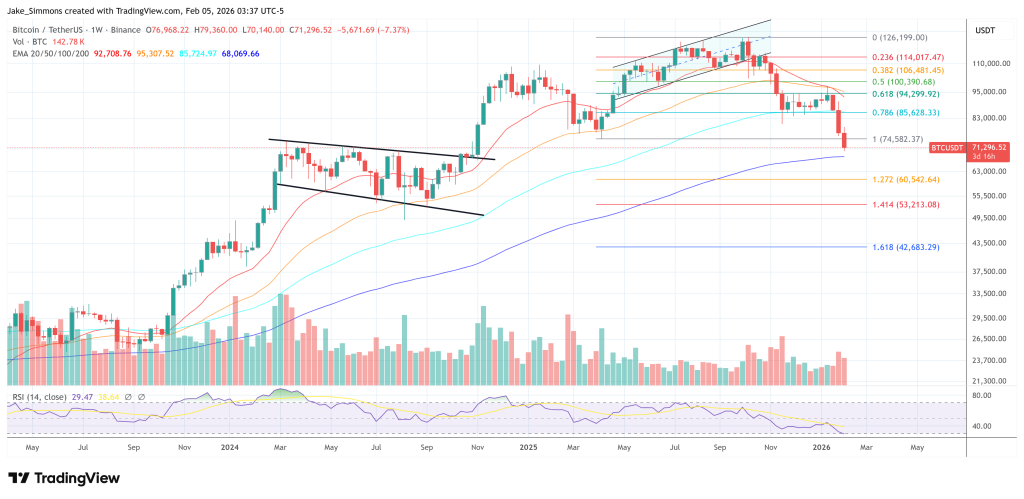
Bitcoin closed January at $78,000, he said, marking a roughly 40% decline from the cycle’s all-time high at $126,000. On his chart, the 200-week moving average closed at $58,000 and realized price at $55,000, with the January RSI ending at 49, a level he treats as a regime shift.

“RSI here, 49. RSI, as you know, is an index between 0 and 100. And everything above 50 is an uptrend. Everything below 50 is downtrend,” PlanB said. “So 49 is below 50, it’s downtrend. It’s a bear market… similar to 2014–15, 2018–19 and 2022–23.”

4 Bitcoin Bear Market Scenarios

From there, he outlined four scenarios for how the drawdown could evolve. The first is the historical “worst case” that still sits in traders’ mental models: an 80% drop from the top. With an ATH of $126,000, PlanB said that would imply a move to roughly $25,000 — “somewhere here between these two lines” on his chart, even if he acknowledged it would “look really really odd.”

The second scenario is more conventional by his own backtests: a bottom around the 200-week moving average and realized price, which he pegged in the $50,000–$60,000 level. PlanB pointed to prior cycles where price eventually “drop[s] to the moving average realized price levels,” highlighting 2022 and 2015 as examples where the RSI trough coincided with those long-term anchors.

The third scenario is shallower still: a retrace that stops just above the prior cycle’s all-time high, around $69,000–$70,000. PlanB’s reasoning is that the preceding bull phase looked muted in his indicators, which could compress the magnitude of the bear.

“So what I think is… because the bull market was very weak… it didn’t have the red dots, the high RSI peaks,” he said. “Because of that, the bear market could be very shallow. And that would mean, for example, going back to the level or just be above the level of the… previous all-time high, which was 69,000.”

The fourth scenario is the one traders always want on their screens: that the market already printed its low. PlanB wrote that “yesterday’s $72.9k was the bottom,” and reiterated in the video that “maybe the $72.800 that we saw a couple days ago was already the bottom.” Notably, the BTC price already dropped to $70,140 on Wednesday, invalidating this scenario.

PlanB also revisited his stock-to-flow framework, saying it remains at $500,000 as a value signal derived from scarcity while stressing it is not built to call turning points. “Stock to flow says nothing about tops and bottoms,” he said, adding that it speaks to “the four-year average” and periodic “phase transition every four or five years.”

That caveat set up his final point: the cycle template may be shifting. PlanB noted that in his four-year-cycle view, the peak historically lands in the first or second year after a halving, but “it didn’t happen after 2024 halving.” In his telling, that leaves room for an upside phase later in the cycle, even as his nearer-term framework keeps the focus on whether bitcoin gravitates toward realized price and the 200-week average, holds the prior ATH zone, or validates a higher low in the low-$70,000s.

At press time, BTC traded at $

Bitcoin price chart
Market Opportunity
4 Logo
4 Price(4)
$0.00995
$0.00995$0.00995
+1.11%
USD
4 (4) Live Price Chart
Disclaimer: The articles reposted on this site are sourced from public platforms and are provided for informational purposes only. They do not necessarily reflect the views of MEXC. All rights remain with the original authors. If you believe any content infringes on third-party rights, please contact service@support.mexc.com for removal. MEXC makes no guarantees regarding the accuracy, completeness, or timeliness of the content and is not responsible for any actions taken based on the information provided. The content does not constitute financial, legal, or other professional advice, nor should it be considered a recommendation or endorsement by MEXC.

You May Also Like

‘Big Short’ Michael Burry flags key levels on the Bitcoin chart

‘Big Short’ Michael Burry flags key levels on the Bitcoin chart

The post ‘Big Short’ Michael Burry flags key levels on the Bitcoin chart appeared on BitcoinEthereumNews.com. The famous ‘Big Short’ investor Michael Burry made
Share
BitcoinEthereumNews2026/02/05 21:54
Solana Price Prediction: SOL Tipped for 3x Boom While Little Pepe (LILPEPE) Gains 100x Speculation

Solana Price Prediction: SOL Tipped for 3x Boom While Little Pepe (LILPEPE) Gains 100x Speculation

Right now, the crypto community is buzzing with excitement as Solana (SOL) keeps gaining steam. Little Pepe (LILPEPE), a Layer 2 meme coin, is also on the rise in the market due to speculation about 100x returns. It’s clear that investors are watching a wide range of opportunities, given Solana’s impressive price hike over the
Share
Coinstats2025/09/19 04:30
New Zealand Dollar declines to near 0.5650 as dovish RBNZ overshadows US tariff relief

New Zealand Dollar declines to near 0.5650 as dovish RBNZ overshadows US tariff relief

The post New Zealand Dollar declines to near 0.5650 as dovish RBNZ overshadows US tariff relief appeared on BitcoinEthereumNews.com. The NZD/USD pair drifts lower to around 0.5655 during the Asian trading hours on Tuesday. The New Zealand Dollar (NZD) softens against the US Dollar (USD) amid an imminent rate cut from the Reserve Bank of New Zealand (RBNZ). Traders await the release of the US September Nonfarm Payrolls (NFP) report later on Thursday.  The RBNZ cut the Official Cash Rate (OCR) to 2.5% at its October meeting after a larger-than-expected 0.9% contraction in Gross Domestic Product (GDP) for the second quarter of 2025. A further reduction of 25 basis points (bps) to 2.25% is widely anticipated at the next meeting on November 26, 2025. The RBNZ has already delivered a series of rate cuts throughout 2025 in an attempt to stimulate a struggling economy.  The prospect of the RBNZ’s aggressive rate-cutting policy overshadowed the US decision to roll back tariffs on Kiwi exports. This, in turn, could exert some selling pressure on the NZD and acts as a tailwind for the pair. In the near term Meanwhile, US President Donald Trump lifted tariffs on more than 200 food products in response to rising US grocery prices. On Sunday, New Zealand welcomed the announcement that it would remove additional tariffs on a range of New Zealand agricultural products, including beef, offal, and kiwi fruit.  Trump removed tariffs on New Zealand exports on more than 200 food products, including beef, amid consumer concerns about rising US grocery prices. It is worth about NZ$2.21 billion ($1.25 billion) annually.  Hawkish remarks from Fed policymakers ahead of a deluge of US economic data spooked traders and could weigh on the USD. Kansas City Fed President Jeffery Schmid said on Friday that monetary policy should lean against demand growth, adding that current Fed policy is “modestly restrictive,” which he believes is appropriate.  New Zealand Dollar FAQs The New…
Share
BitcoinEthereumNews2025/11/18 10:59